Retention Ratio
Shows what portion of a company's earnings is retained and reinvested into the company instead of being handed out to stakeholders as dividends.


What is the Retention Ratio?
The retention ratio, also known as the net income retention ratio or plowback ratio, shows what portion of a company's earnings is retained and reinvested into the company instead of being handed out to stakeholders as dividends.
It's like the savings a company makes from its profits for plans. This ratio is crucial as it reflects how much earnings are channeled back into the company for growth.
Understanding this ratio helps investors gauge a company's financial strategy. A higher ratio often indicates that the company is prioritizing growth and expansion. Conversely, a lower ratio might suggest a focus on rewarding shareholders through dividends.
By tracking changes in this ratio over time, analysts and investors can get insights into how a company manages its profits. A steadily increasing ratio might signal potential for future growth, while a sudden drop could hint at strategy or financial health changes.
This ratio is a financial compass guiding investors on how a company allocates its earnings—balancing fueling growth and rewarding its stakeholders.
- The retention ratio shows what portion of a company's earnings is retained and reinvested into the company instead of being handed out to stakeholders as dividends.
- The ratio can be calculated by dividing retained earnings by the company's net income.
- A higher ratio often indicates that the company is prioritizing growth and expansion. Conversely, a lower ratio might suggest a focus on rewarding shareholders through dividends.
- Newer or smaller companies in their initial growth phase often flaunt higher retention ratios.
Retention Ratio Formula
Calculating this ratio is like peeking into a company's financial strategy. One way to do this is by dividing retained earnings by the company’s net income. Think of retained earnings as the amount a company keeps for itself from its net profits.
Retained Earnings = Net Income - Dividends
The formula for calculating the ratio is:
Retention Ratio = Retained Earnings / Net Income
The net income can be located at the base of the company's income statement, whereas retained earnings or dividends may appear on the shareholders’ equity section of the balance sheet or in the cash flow from the financing activities section.
To obtain the plowback ratio per share, one should simply divide the numerator and the denominator of the plowback ratio formula by the company’s average number of outstanding common shares. Therefore, the formula for the ratio on a per-share basis is:
Retention Ratio = (EPS - Dividends Per Share) / EPS
Another trick to obtaining this ratio is subtracting the dividend payout ratio from 1. The dividend payout ratio reveals the percentage of earnings paid out as dividends. Subtracting this ratio from 1 gives you the part of earnings retained by the company.
Retention Ratio = 1 - Dividend Payout Ratio
These methods offer different ways to unveil how much of a company's earnings get reinvested versus distributed as dividends. Using these formulas, investors and analysts can grasp how a company manages its profits, guiding decisions about its growth potential and financial health.
Retention Ratio Example
Now that we know the formula to calculate this ratio let's dive into a scenario involving a coffee chain, "Brew Heaven," across three years to illustrate the retention ratio's evolution.
In Year 1, Brew Heaven amassed a net income of $500,000 without distributing dividends, resulting in a robust 100% retention ratio. All earnings were retained in the business for growth initiatives.
Progressing to Year 2, Brew Heaven's net income surged to $1,200,000, and it decided to pay out $200,000 in dividends. This move decreased the ratio to 83%, signifying that 83% of earnings were retained for further business development.
In Year 3, the company's net income soared to $2,000,000, and it chose to distribute $400,000 in dividends. Consequently, the ratio dropped to 80%, indicating that 80% of the earnings were reinvested in the company for expansion.
| Year | Net Income | Dividends | Retention Ratio |
|---|---|---|---|
| 1 | $500,000 | $0 | 100% |
| 2 | $1,200,000 | $200,000 | 83% |
| 3 | $2,000,000 | $400,000 | 80% |
The decreasing trend in Brew Heaven's retention ratio over the years suggests a shift towards allocating a larger share of earnings to shareholders rather than retaining them for internal growth. This shift might reflect a strategy prioritizing rewarding investors, potentially impacting the pace of future expansion.
Comparing these ratios with competitors or industry benchmarks would shed light on Brew Heaven's approach relative to the broader market, helping investors gauge its growth strategy and potential.
For this, let's introduce a rival to Brew Heaven, "RoastElysium,” and compare their ratios over the same three-year period to gain insights into their respective strategies.
Brew Heaven Data
| Year | Net Income | Dividends | Retention Ratio |
|---|---|---|---|
| 1 | $500,000 | $0 | 100% |
| 2 | $1,200,000 | $200,000 | 83% |
| 3 | $2,000,000 | $400,000 | 80% |
RoastElysium Data
| Year | Net Income | Dividends | Retention Ratio |
|---|---|---|---|
| 1 | $600,000 | $50,000 | 91.67% |
| 2 | $1,000,000 | $150,000 | 85% |
| 3 | $1,800,000 | $350,000 | 80.56% |
Analyzing both companies, Brew Heaven initially had a higher plowback ratio than RoastElysium in Year 1, suggesting a more aggressive reinvestment of earnings into growth initiatives. However, by Year 3, both companies converged at a similar ratio of around 80%, albeit with different growth trajectories.
RoastElysium, despite starting with a slightly lower ratio, maintained a relatively stable ratio over the years, indicating a consistent approach to balancing dividends and reinvestment.
On the other hand, Brew Heaven experienced a more pronounced decline in its retention ratio over the same period, possibly signaling a shift towards greater dividend payouts over reinvestment.
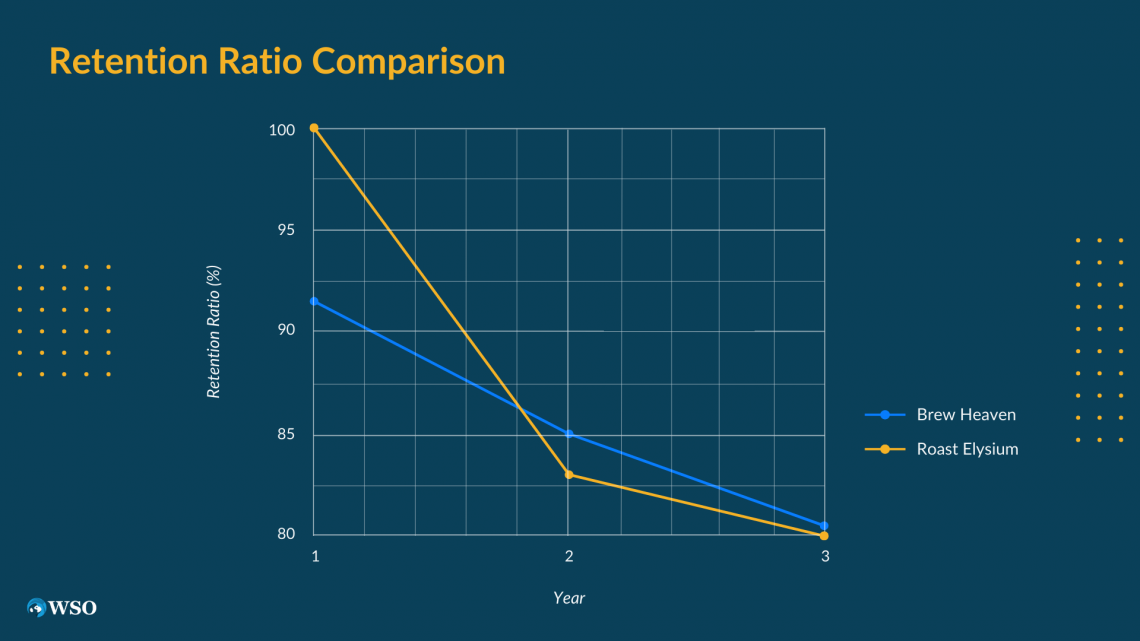
Comparing these ratios indicates that while both companies favored distributing earnings to shareholders, Brew Heaven demonstrated a more substantial decrease in the ratio in the same period, potentially suggesting a more aggressive dividend distribution strategy than RoastElysium.
This difference in strategies might impact Brew Heaven's growth trajectory relative to RoastElysium and could influence investor perceptions regarding future growth potential.
Understanding the interplay between plowback ratios and financial forecasts unveils the financial compass guiding each company's journey and aids investors in making informed decisions.
Interpreting the Retention Ratio
The plowback ratio speaks volumes about a company's financial strategy but is not a standalone indicator of its health. Understanding a company's business environment is vital in interpreting this ratio.
Newer or smaller companies in their initial growth phase often flaunt high retention ratios. They prioritize growth, plowing earnings back into their business for research or expansion.
Conversely, larger, established companies, having reached their mature phase, usually sport lower retention ratios. They do not need to reinvest as heavily in research or business development as newer companies.
Instead, they opt to pay consistent dividends to the shareholders in preference to retain earnings and have a relatively lower plowback ratio.
Yet, deciphering a single ratio won't tell the full story. Analysts dive deeper, comparing a company's ratio to its industry peers. This comparative analysis unveils insights, allowing us to gauge how one company handles its earnings relative to others on the same playing field.
Advantages of Using the Retention Ratio
The retention ratio offers a comprehensive view of a company's financial health, growth potential, and strategic decisions, aiding investors, analysts, and management in making informed decisions. Let us see some of the advantages of using this ratio.
- Insight into Reinvestment Strategies: This ratio clearly shows how much profit a company chooses to reinvest in its growth and development rather than distributing it as dividends. It helps understand the company's reinvestment strategies and commitment to future expansion.
- Assessment of Financial Health: A higher plowback ratio often indicates that the company is retaining more earnings, signaling potential opportunities for internal growth. This can indicate a financially healthy organization investing in research, innovation, and expansion initiatives. It portrays that the company is confident about its prospects and is channeling funds for sustainable long-term growth. This confidence might attract potential investors seeking stability and growth prospects in the company.
- Comparative Analysis: Comparing the plowback ratio within an industry or against competitors offers valuable insights. It allows for a comparative analysis to evaluate how a company’s reinvestment strategies align with industry norms and whether they are more aggressive or conservative.
- Balancing Dividend Payouts: It also plays a pivotal role in balancing dividend payouts. By adjusting the proportion of earnings retained within the company and the amount distributed as dividends, businesses can strike a balance that caters to the company’s expansion and shareholders’ interests.
Limitations of Using the Retention Ratio
The retention ratio is a valuable indicator in financial analysis, reflecting a company's reinvestment of earnings instead of distributing them as dividends. However, it's crucial to recognize the limitations inherent in relying solely on this metric for comprehensive insights into a company's financial health and strategy.
- Industry Dependency: Understanding industry norms and dynamics is vital. Industries vary significantly in their capital requirements and growth trajectories. Comparing retention ratios across sectors without considering these differences can lead to misguided conclusions.
- Dynamic Nature: A company's retention ratio might fluctuate over time due to various factors like expansion plans, changes in market conditions, or dividend policy shifts. This variability requires a nuanced approach to interpreting the ratio's implications accurately.
- Strategic Intent: The retention ratio doesn't unveil the rationale behind a company's decisions. A low ratio might suggest a focus on dividends, but it could also indicate a lack of investment opportunities or strategic shifts unrelated to financial health.
- Interplay with Other Metrics: Relying solely on this ratio without considering complementary metrics like return on equity (ROE), debt-to-equity ratio, or profit margins may provide an incomplete picture of a company's financial standing and growth prospects.
Conclusion
The retention ratio isn't a one-size-fits-all measure; it's a window into a company's intentions. Industry norms and investor expectations shape what's considered high or low for this ratio. Comparing within the same industry paints a clearer picture.
There's no fixed range for this financial ratio. It's a piece of a larger puzzle. Factors like growth stage, profitability goals, and market dynamics shape a company's retention decisions.
This ratio offers a glimpse into a company's plans but doesn't dictate its future alone. It's just one indicator among many. Understanding a company's strategy requires looking beyond this number and considering its context and aspirations.
Investors must dissect this ratio alongside other financial metrics to accurately forecast a company's growth potential.
Considering this, we have learned about the retention ratio and how it can be interpreted to gain insights into the company’s financial strategies. We hope this article proves useful as you progress in finance and investing.

Everything You Need To Master Financial Statement Modeling
To Help You Thrive in the Most Prestigious Jobs on Wall Street.


or Want to Sign up with your social account?