Return on Assets & ROA Formula
Profitability ratio that measures the return generated by a company’s assets


What Is Return On Assets (ROA)?
Return on assets (ROA) is a profitability ratio that measures the return generated by a company’s assets. ROA is calculated by dividing a company’s net income by its average total assets.
A high ratio indicates that a company efficiently uses its assets to generate a profit.
When comparing the ROA of multiple companies, it is important to compare it with companies in the same industry because financial ratios can vary substantially from one industry to the next.
The formula to calculate the return on assets for a company is as follows:
Return On Assets =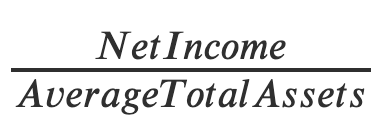
Where
- Net Income: Revenue – Expenses
- Average Total Assets: Current Assets + Non-Current Assets at the beginning of the period plus Current Assets + Non-Current Assets at the end of the period divided by 2.
Net income can be found as the last item on the income statement. Average total assets can be calculated using a company's balance sheet, which can be calculated by adding a company’s liabilities with its shareholders’ equity.
ROA can also be calculated using ending total assets in the denominator instead of average total assets; however, the ratio may not be the same if the difference between the beginning and ending total assets is substantial.
The formula to calculate the return on assets using ending total assets for a company is as follows:
Return On Assets = ![]()
- Net Income: Revenue – Expenses
- Ending Total Assets: Current Assets + Non-Current Assets as of the end of the measurement period.
Key Takeways
- This financial ratio is used to assess the productivity and efficiency of the assets in the organization.
- The higher the ROA, the greater productivity and the more efficiently the assets are used and vice versa.
- Lower ROA may indicate that the net income is too low compared to assets at disposal, meaning the assets aren’t used to their full efficiency and productivity.
- There are two limitations of the ROA: Interest expense and EBIT, which analysts adjust by adding them back to NI to get an unbiased picture of the financial statements and ROA.
Example of ROA Calculation
Let’s assume a company is calculating its ROA and gathers the following information:
- Revenues: $400,000
- Expenses: $100,000
- Total Assets at the beginning of the period: $1,037,000
- Total Assets at the end of the period: $1,028,000
Net income is calculated as follows:
Net Income = Revenues - Expenses
$300,000 = $400,000 - $100,000
Average total assets are calculated as follows:
Average Total Assets = Beginning Total Assets + Ending Total Assets/ 2
$1,032,500 = $1,037,000 + $1,028,000/ 2
Now that we have both net income and average total assets, we can calculate ROA.
29.01% = $300,000/ $1,032,500
This means that for every dollar the company invested in assets, that dollar generated a return of 29 cents.
Although the ROA for this company may appear to be very high compared to its peers, the company could actually be inefficient in generating income through its assets.
What Is Considered a Good ROA?
When looking at financial ratios, it is important to compare them across companies. It is also important to compare the ratios to companies within the same industry.
When ratios are viewed in isolation, a ratio may provide very little information about the company’s performance and operating efficiency.
For example, let’s assume an analyst calculates the ROA of a company to be 5%. Without a proper comparison, this may seem like a low ratio. But when the analyst compares the company’s ROA to its peers, they discover that it is in line with the industry average ROA of 5%.
A ROA of 5% is considered good, while a ROA in excess of 19% is considered excellent; however, comparing a company’s ROA to its peers is still important.
It is also important to compare financial ratios with companies in the same industry. The ROA for a consumer packaged goods company (with many assets) will differ substantially from that for a technology company (with fewer assets).
Below we will discuss high and low return on asset ratios:
1. High ROA
- A high ROA relative to a company’s peers indicates that the company has fewer assets generating income.
- A higher ROA is often desired since it indicates that the business is profitable and a sign of operation efficiency, i.e., the company is good at using its assets to generate sales.
2. Low ROA
- A low ROA relative to a company’s peers indicates that the company has more income-generating assets.
- Companies with low ROAs usually have more debt because they must finance their day-to-day operations.
Return on Assets (ROA) vs. Return on Equity (ROE)
Return on Assets (ROA) and Return on Equity (ROE) are important financial metrics that show how effectively a company uses its resources to generate profits. The key distinction between these two metrics, however, is how they treat a company's debt and leverage.
ROA (Return on Assets):
ROA provides a comprehensive view of a company's efficiency by taking both equity and debt into account. It assesses how efficiently a company generates profits in relation to the total resources under its control. In essence, it considers the return on all assets, regardless of whether they are financed with equity or borrowed funds. The return on assets (ROA) reflects the overall effectiveness of resource utilization and capital structure.
ROE (Return on Equity):
In contrast to ROA, ROE focuses solely on a company's equity returns, excluding debt and liabilities. It reveals how effectively a company generates profits solely from the investments of its shareholders. This metric is especially important for stockholders and equity investors. ROE shows the return on the owners' investments while accounting for any financial leveraging.
| Aspect | ROA (Return on Assets) | ROE (Return on Equity) |
|---|---|---|
| Definition | Measures how efficiently a company generates profits from its total assets. | Measures the return generated on shareholders' equity investments. |
| Components Included | Considers all resources, including equity and debt, in the calculation. | Excludes debt and focuses solely on equity in the calculation. |
| Debt Consideration | Accounts for a company's debt, reflecting its leverage and capital structure. |
Ignores debt and liabilities, providing a limited view of financial leverage. |
| Use in Analysis | Used to assess a company's overall efficiency in resource utilization. | Primarily used to evaluate the performance of equity investments by shareholders. |
| Example Scenario | If a company takes on significant debt, ROA might decline due to the higher asset base. | If a company takes on significant debt, ROA might decline due to the higher asset base. |
In simpler terms, ROE is more favorable to financial leverage, whereas ROA provides a more comprehensive assessment of resource utilization and the impact of both equity and debt on a company's profitability. Understanding these metrics is therefore critical for investors and stakeholders because they provide insight into a company's financial health and capital structure.
ROA Trends
When calculating ROA, it is recommended that ROA be calculated over multiple periods because a high or low ROA in one period may not accurately depict how efficiently a company uses its assets to generate a profit.
For example, a company that usually has an inline or exceeds the industry average may have a low ROA in the current period because it is allocating funds to develop a new product.
If the current period ROA is viewed in isolation, one might think the company is not using its assets efficiently.
The same applies to a company with a lower ROA than the industry average but may have a very high ROA in the current period because it has sold many of its assets at a discount to pay creditors.
If the current period ROA is viewed in isolation, one might think the company is efficient at generating a profit, but the company is struggling financially.
The trends and preferred ROA ratios may also depend on the industry and industrial averages. An organization in a capital-intensive industry, where the average assets will be more compared to a labor-intensive company.
The ROA may not be entirely useful for tech companies, where they might have no or little fixed assets to account for.
This difference in equipment on the balance sheet of both companies will have a considerable impact on the ROA.
A high ratio indicates fewer assets generating more profits and points out the fact that the assets are being used productively and efficiently.
Limitations of ROA
Return on assets is an excellent way to measure how efficiently a company uses its assets to generate income; however, it has some limitations. Fortunately, there are methods to overcome these limitations.
1. ROA Limitations: Interest Expense
The first limitation of the original ROA ratio is that net income is the number of funds available to equity holders. At the same time, average total assets are funds available to debt and equity holders.
To overcome this, interest expense is added back to net income. It is added back to net income because interest expense is the return due to the holders of the company’s debt.
The formula for ROA with interest expense added is as follows:
Return On Assets = Net Income + Interest Expense (1-Tax Rate)/ Average Total Assets
Where
- Net Income: Revenue – Expenses
- Interest Expense: Amount owed to holders of the company’s debt
- (1 - Tax Rate): Interest expense must be adjusted for taxes because net income is an after-tax value
- Average Total Assets: Current Assets + Non-Current Asset
2. ROA Limitations: Operating Income (EBIT)
The second limitation is that the numerator of ROA is calculated on an after-tax basis. Some analysts adjust net income by adding back interest and taxes. By doing so, the numerator becomes operating income or earnings before interest and taxes (EBIT).
Analysts may prefer operating income because companies are subject to different tax rates depending on where they do business.
For example, assuming both companies are peers within the same industry. This company only generates its income in the United States versus a company that does some business in the United States. Still, many businesses in China will likely be subject to very different tax rates.
The formula for ROA with interest and tax expense added back is as follows:
Return On Assets = Net Income + Interest Expense (1-Tax Rate) + Taxes Paid/ Average Total Assets
Where
- Net Income: Revenue – Expenses
- Interest Expense: Amount owed to holders of the company’s debt
- (1 - Tax Rate): Interest expense must be adjusted for taxes because net income is an after-tax value
- Taxes Paid: Total amount of taxes paid in the current period
- Average Total Assets: Current Assets + Non-Current Assets


Free Resources
To continue learning and advancing your career, check out these additional helpful WSO resources:


or Want to Sign up with your social account?