CDS Payout Ratio
The ratio represents the proportion of the insured amount the seller pays if the underlying asset defaults to the CDS holder.


What is the CDS Payout Ratio?
The CDS Payout Ratio represents the proportion of the insured amount the seller pays if the underlying asset defaults to the CDS holder.
It is calculated as follows.
CDS Payout Ratio = Payout Received / Maximum Possible Payout
Let's see an example of how to calculate this ratio.
Suppose an investor holds ¥500,000,000 (¥500M) worth of 5-year Japanese government bonds with a coupon rate of 4.5% per annum. The investor is worried about a possible recession in Japan and decides to buy credit default swaps (CDS) for his bonds from a bank.
The CDS requires an upfront premium of 2% and yearly premiums of 1% of the insured amount (¥500M). Now suppose Japan defaults on all bond holdings over ¥100,000,000. The investor receives ¥100,000,000 from the Japanese government and ¥400,000,000 from the bank.
In this case, the investor's CDS payout ratio is 98%.
CDS Payout Ratio = ¥400,000,000 / ¥500,000,000 = 0.80 = 80%
While this might seem like an incredibly simple calculation for something involving so many values and numbers, the CDS payout ratio is a simple concept. It is simply the ratio of how much you receive from the CDS payout to how much you originally invested.
In this example, the only information pertinent to calculating the CDS payout ratio was the ¥400,000,000 received from the bank and the initial ¥500,000,000 invested. The other values presented in the example concern the hedging process and the risks involved.
However, to understand all of the percentages and values within that example, we must first understand credit default swaps (CDS) and the inherent risks involved by both the investor and the bank issuing the CDS.
- The CDS Payout Ratio is the proportion of the insured amount paid out in the event of a default.
- International bonds typically offer higher interest rates than domestic bonds due to the increased risks, including exchange rate volatility, political and economic instability, and differing regulatory environments.
- International bonds include various types, such as foreign bonds, Eurobonds, and global bonds. Each type has specific characteristics, advantages, and regulatory requirements, allowing issuers and investors to choose based on their needs and risk appetite.
- Credit events such as default, failure to pay, obligation acceleration, repudiation, moratorium, obligation restructuring, and government intervention trigger the settlement of a CDS contract, leading to a payout to the CDS holder.
Understanding CDS Payout Ratio
Now that we've seen what a CDS is and how both parties prepare their terms and credit events, we can see more examples of CDS payouts. Recall that the CDS payout ratio is simply the ratio of CDS payout to the original value being hedged.

Let's see another example.
A bank loaned out $100,000,000 at 10% for 20 years to a construction company to construct a shopping mall. By law, the bank has to insure this loan due to its amount. So it purchases a CDS from another financial firm.
This CDS required an upfront premium of 3% and yearly premiums of 5% of the insured amount ($100M) for the next 20 years. In return, the firm will cover the unpaid amount if the construction company defaults.
Suppose the construction company defaults due to unforeseen circumstances and still owes $25,000,000 of the initial loan. The bank can claim this amount from the firm's CDS, resulting in a 25% CDS payout ratio.
CDS Payout Ratio = $25,000,000 / $100,000,000 = 0.25 = 25%
Remember that while the bank recovered the original amount loaned out, where $75,000,000 was already paid, and the $25,000,000 was covered by the CDS, it still had to pay to get the CDS and make yearly payments for it.
Additionally, the bank would lose any further interest payments since the loan defaulted. Therefore, calculating the final value of the bank's loan would require the same process as the Japanese government bond investor example.
What are Credit Default Swaps?
A credit default swap (CDS) is a credit derivative used to hedge against default risk. In other words, it's a type of insurance. In this case, a CDS exchanges a coupon against the payment of a loss caused by the defaulted security.
Credit default swaps (CDS) are usually publicly known products that can be bought, sold, and traded. For example, The Depository Trust and Clearing Corporation (DTCC) has an electronic central registry for CDS.
Note
To hedge against a risk means to invest in a position to offset potential losses that the accompanied investment could incur.
Utilizing the previous example (the Japanese government bond investment), the investor paid an upfront premium of 2% and a yearly premium of 1% of the insured amount in exchange for receiving a payment of the remaining amount if the security defaults.
The investor is worried about his exposure and buys a CDS from a bank to hedge against the default risk. The bank issuing these CDSs believes that the Japanese bonds won't default.
If the investor is wrong, they only lose the money they paid to the CDS, and the bank doesn't have to pay out anything, gaining the premiums paid by the investor. However, if the investor is right, they don't lose as much since they "insure" any losses via the CDS, paid out by the bank.
Think of it as the investor and the bank betting against the investor's initial investment. In this situation, the other values presented in the example matter.
Example Of Credit Default Swaps
Credit derivatives, such as credit default swaps, are used to protect against the risk of default. They can be thought of as a form of fictitious insurance that generates revenue. A CDS is a contract wherein a fixed (or variable) coupon is exchanged for the payment of a loss resulting from a certain security default.

Let's see the previous example again but from a different perspective.
Suppose an investor holds ¥500,000,000 (¥500M) worth of 5-year Japanese government bonds that pay a coupon rate of 4.5% per annum. The investor is worried about a possible recession in Japan and decides to buy credit default swaps (CDS) for his bonds from a bank.
The CDS requires an upfront premium of 2% and yearly premiums of 1% of the insured amount (¥500M). Now suppose Japan defaults on all bond holdings over ¥100,000,000. The investor receives ¥100,000,000 from the Japanese government and ¥400,000,000 from the bank.
Let's analyze the values herein presented.
The 4.5% per annum coupon rate means the investor is paid ¥22,500,000 annually from the bonds.
¥500,000,000(0.045) = ¥22,500,000
The investor pays 2% of ¥500,000,000 upfront, which is ¥10,000,000.
¥500,000,000(0.02) = ¥10,000,000
Additionally, the investor must pay 1% of the insured amount every year, which is ¥5,000,000 annually.
¥500,000,000(0.01) = ¥10,000,000
If the bank "wins the bet" (the Japanese government doesn't default on the bonds), the bank makes no payments to the investor and gains ¥10,000,000 plus the yearly ¥5,000,000 for 5 years. This comes to a total of ¥35,000,000 gained.
At the end of the five years, the investor would receive ¥500,000,000 from the Japanese government. This, along with the yearly ¥22,500,000 from the coupons, brings a total gain of ¥612,500,000.
However, since the investor paid a total of ¥35,000,000 to the CDS, their net total is ¥577,500,000. Therefore it was worth hedging against the default risk in this case since the investor stayed above their initial investment.
That said, one can't truly predict the future - especially knowing how much will be defaulted. In this case, the investor maintained a positive result after hedging and "losing the bet."
However, remember that they could have just as easily obtained a total of less than ¥500,000,000 after all pertinent costs.
Let's see what happens when the investor "wins the bet."
If the Japanese government defaulted per the example, the investor would only receive ¥100,000,000 from the bonds, for a loss of ¥400,000,000 (discounting coupons). However, since they hedged against it, they only lost ¥100,000,000 along with the pertinent CDS costs.
In this case, the bank "lost the bet" and has to pay out ¥400,000,000 to the investor. Therefore, the bank would take a ¥365,000,000 loss (¥400,000,000 paid - ¥35,000,000 CDS costs).
What are Credit Events?
A credit event is a trigger that causes the CDS contract to be settled. These events are agreed upon on purchase and part of the CDS contract.
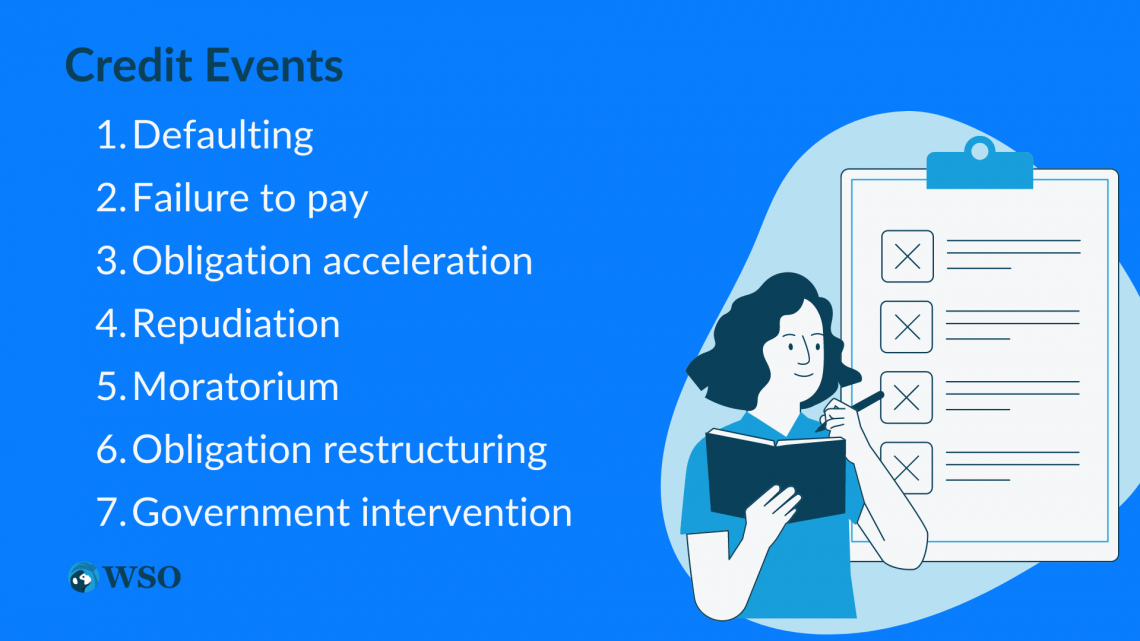
Some common credit events include
- Defaulting: For example, when a government defaults on specific bonds.
- Failure to pay: Some payment failures arise from other causes besides defaulting. For example, a company fails to pay any significant bills or debts.
- Obligation acceleration: This refers to moving contract obligations, usually when the issuer needs to pay earlier than expected. For example, the terms of a contract are changed, and specified payments need to be made earlier than previously established.
- Repudiation: This occurs when the validity of a contract is disputed and/or the contract's terms are not being honored. For example, any breach of contract might be seen as not honoring its terms.
- Moratorium: This is a contract suspension until pertinent issues are solved. For example, if a business has exceeded its budget, it might put a moratorium on new hiring until the following fiscal year.
- Obligation restructuring: This is when underlying loans are restructured. For example, the loan might be restructured at a much higher interest rate.
- Government intervention: This can involve any government actions that affect the contract. For example, new laws are put in place that render any contracts no longer legally binding or viable.
The CDS was settled due to the government default trigger in the Japanese government bond investor example. This is what the investor was hedging against, so it is definitely what the terms of the CDS contract would have specified.
CDS Payout Ratio FAQs

The CDS Payout Ratio represents the proportion of the insured amount the seller pays if the underlying asset defaults to the CDS holder.
The formula is as follows:
CDS Payout Ratio = Payout Received / Maximum Possible Payout
A credit default swap (CDS) is a credit derivative used to hedge against default risk.


Free Resources
To continue learning and advancing your career, check out these additional helpful WSO resources:


or Want to Sign up with your social account?