Descending Triangle
A bearish technical analysis term that refers to a downtrend continuation pattern.


What Is A Descending Triangle?
A descending triangle is a standard technical analysis tool is triangle patterns. Understanding market patterns as they emerge is crucial for all traders. Patterns are essential for traders looking to identify trends and forecast future events to trade more successfully and profitably.
The market will continue. Additionally, they can help a trader identify a market reversal.
A descending triangle is a bearish technical analysis term that refers to a downtrend continuation pattern where one trend line, creating lower highs, connects to a horizontal support line.
Typically, traders want to go short on security after it breaks the horizontal support line because a downtrend continuation is expected. However, these patterns can also form as reversals in an uptrend.
These patterns can take minutes, hours, or weeks to form. The descending resistance trendline in the pattern signals traders that demand is weakening and a big move down is imminent.
Descending triangles typically form a continuation pattern in a downtrend. However, there are examples where these patterns could also reverse an uptrend.
This article will explain the different components of this trading pattern, highlight a few examples of DT, and compare them to similar triangle patterns.
- A descending triangle is a bearish chart pattern in technical analysis. It consists of lower highs and a horizontal support line, indicating that sellers are more aggressive than buyers, leading to a price decline over time.
- The pattern has two trendlines: a descending trendline connecting the lower highs and a horizontal trendline acting as support. The price moves within this triangle, forming peaks and troughs.
- The descending triangle is a continuation pattern, indicating that a downtrend will likely continue when the price breaks below the horizontal support line, signaling a potential opportunity to enter a short position.
- Traders use stop-loss orders to manage risk when trading descending triangles. A common strategy is to place a stop-loss above the last lower high within the triangle to limit potential losses in case of a false breakthrough.
The Components of a Descending Triangle
Any trading pattern has many moving parts, and a DT is no different. Traders will ensure all the components are met before executing a trade.
We will now examine all the components to look for when trading DT.
- The Trend: As mentioned before, this pattern typically occurs as a part of a downtrend continuation pattern. However, unlike symmetrical triangles, DT is naturally bearish, meaning the trend isn't as important as the pattern itself.
- The Horizontal Support Line: A support line typically consists of two or more lows that connect to form a horizontal line. Sometimes, the lows are at different levels, making the pattern weaker.
- The Descending Resistance Line: The resistance line typically consists of two or more highs that connect to form a descending line. The high points should be successively declining to create a down-trending line.
- The Retest of the Support Line: In the world of pattern trading, support lines that break turn into resistance lines and vice versa.
- That said, a descending triangle will often break under the support line and retest it as resistance. This isn’t always the case, but it can sometimes be used to confirm the pattern.
- Duration: The pattern length can range from a few minutes to a few hours to a few months. Triangle patterns happen in every time frame, and it is up to traders to determine which time frame they prefer trading in.

The pattern above is on the daily chart of the stock AVGO. Notice how the resistance line connects three successively declining points, and the support line connects three low points.
Note that this pattern has not broken down yet; traders will typically wait for a confirmation break before executing their short position.
A Descending Triangle Example
Now we will look into a real-life example of a descending triangle that broke down. Please follow along with the chart below. This pattern started forming in the Zoom stock on November 26th, 2021 and broke under the support line on January 7th, 2022.
Follow along with the chart to understand the moving parts that made this trade possible.
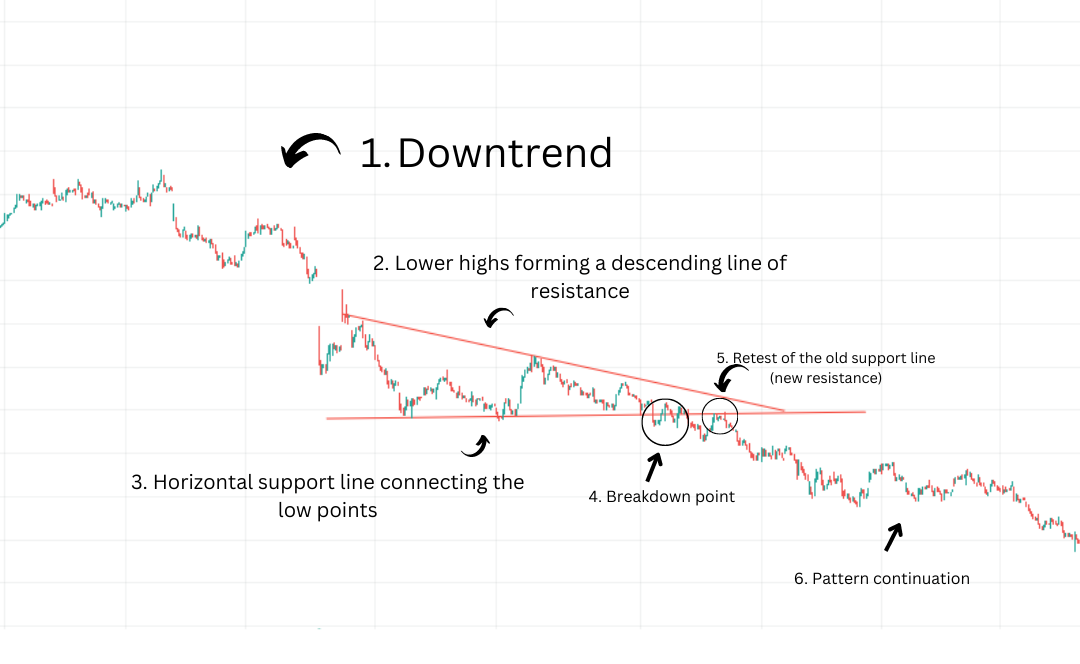
- Downtrend: Notice how the stock was already in a downtrend before the pattern started. However, as mentioned above, this is only sometimes the case.
- Descending Resistance Line: The resistance trendline connects three points that are successively making lower highs, which is a requirement for a descending triangle.
- Horizontal Support Line: The support trendline connects three points to form a horizontal line, which is also required for a descending triangle.
- Breakdown Point: The breakdown or entry point represents the ideal entry for a trader to execute a trade and go short on the stock.
- Retesting Support: Support that gets taken out will now act as resistance. After the stock dropped below the breakdown point, the price action went back up to test that same old Support, which now acts as resistance.
- As mentioned above, there are other conditions for descending triangles. However, it does often give traders confirmation that a continuation to the downside will happen. Some traders also use the support retest point as a second entry for their trades.
- Pattern Continuation: ZM broke under the support line on January 7th, 2022, at a stock price of $172.45 per share. As of today, September 9th, 2022, the stock is trading at $74.45 per share. This represents a move of 56.68% to the downside.
What are Ascending Triangles?
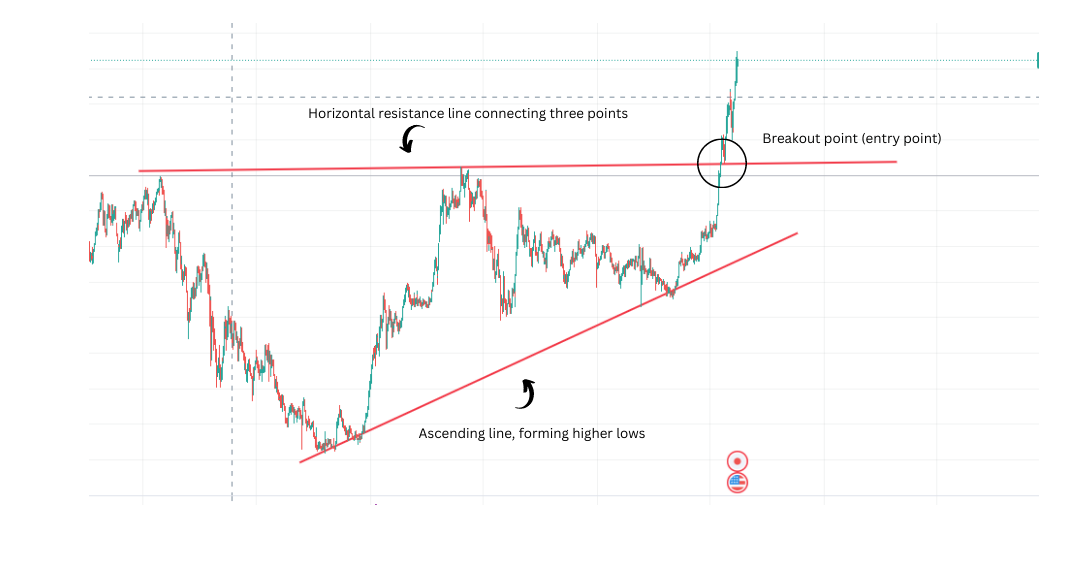
The ascending triangle is the exact opposite of the descending triangle. It is a bullish technical analysis pattern that refers to an uptrend continuation pattern where one trend line, creating higher lows, connects to a horizontal resistance line.
Traders will typically go long on security after it breaks the horizontal resistance line. Ascending triangles will often form a continuation pattern in an uptrend. However, there are instances where ascending triangles form to reverse an uptrend.
Now we will look into a real-life example of an ascending triangle breaking out. This pattern started forming USDJPY on June 25th, 2007 and broke under the support line on April 18th, 2022.
This pattern took about 15 years to form, showing that triangle patterns can take minutes, weeks, or years to form.
What are Symmetrical Triangles?
A symmetrical triangle is a neutral technical analysis pattern that consists of two converging lines. One line forms higher lows, and the other line forms lower highs.
A symmetrical triangle, in contrast to ascending and descending triangles, is neutral in nature. Traders would likely examine the trend that preceded the symmetrical triangle and the breakout point to determine whether to go long or short on the investment.
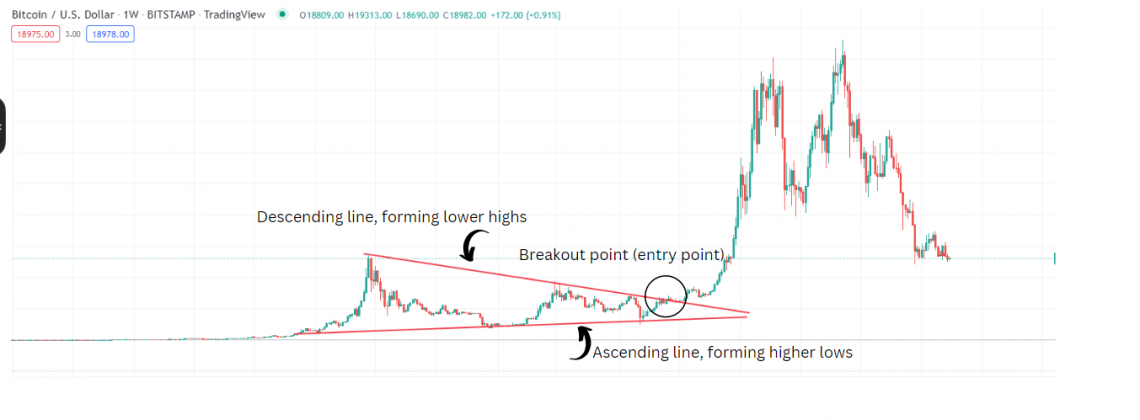
This pattern started forming on BTCUSD on July 10th of 2017, and broke out on July 20th, 2020, starting one of the greatest bull markets in Bitcoin’s history. As you can see, the two trend lines converge, and neither of them is horizontal.
A trader will typically wait for the price action to either break up or break down, and in this situation, the price action breaks out, signaling traders to go long.
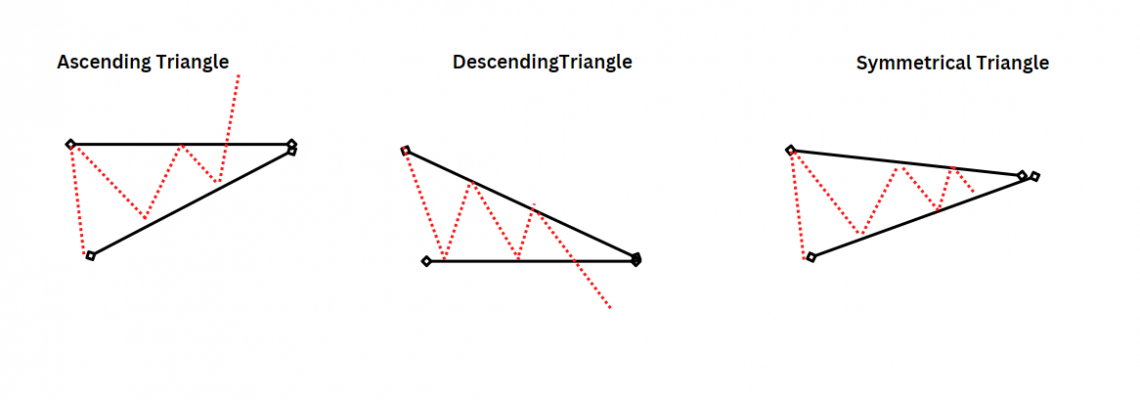
Let us now look at a side-by-side comparison of the different triangle types.
Triangle patterns are significant because they aid in predicting whether a bullish or negative.
Descending Triangle FAQs
A breakout of the ascending trendline can, in some cases, create a bearish signal. The ascending triangle is typically a bullish pattern that develops during an uptrend.
However, it might be viewed as a bearish continuation pattern if it does break out during a downtrend.
A breakout of the descending trendline can, in some cases, create a bullish signal. This triangle is typically a bearish pattern that develops during a downtrend.
However, If it does break out during an uptrend, it can be considered a bullish continuation pattern.
As seen in the above examples, triangle patterns can last anywhere from minutes to hours to weeks. It all depends on what time frame the patterns are developing on.
A wedge pattern will have either two ascending or two descending trendlines, forming either a rising wedge or a falling wedge.
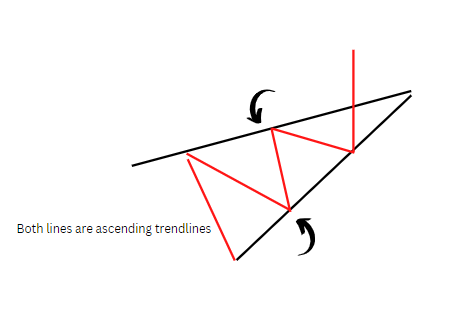
Ascending triangles have one ascending/descending trendline and another horizontal line. Another big difference is that wedge patterns will often signal a reversal of the current trend.


Free Resources
To continue learning and advancing your career, check out these additional helpful WSO resources:


or Want to Sign up with your social account?