Double Top
A popular chart pattern in the stock market technical analysis.


What Is a Double Top?
The Double Top is a popular chart pattern in the stock market technical analysis. The design is used to identify a potential trend reversal. A double top is formed when the price of an asset reaches a certain level twice, fails to break above that level, and then starts to decline.

The two peaks are usually separated by a period during which the price declines somewhat before rising again to the level of the first peak.
The pattern is comprised of the following components:
-
Uptrend: The asset is in an uptrend characterized by higher highs and higher lows.
-
First top: The asset price peaks and retraces downwards, forming the first "top" of the pattern.
-
Reversal: After hitting the peak, the price declines, forming a trough. However, the price bounces back to approximately the same level as the previous peak, including the second "top" of the pattern.
-
Breakdown: After forming the second top, the asset price declines again, so much so that the price dips below the trough between the two tops.
The trough in between the two peaks is called the neckline. When the price falls below the neckline, it confirms the double-top pattern. It signals a potential trend reversal and the start of a downtrend.
The trading volume tends to decrease as the pattern forms and increases as the price falls below the neckline. The pattern is considered complete when the price drops below the neckline, which is the support level and continues to decline.
Traders often use the double-top pattern to identify potential short-selling opportunities or exit long positions.
Note
It is important to note that the double-top pattern is unreliable and should be confirmed with other technical indicators and fundamental analysis before making any trading decisions. Also, traders can look for possible bearish candlestick pattern formations so as to doubly ensure that the trade they choose works in their favor.
- A double top is a bearish reversal pattern in technical analysis, indicating that a stock, commodity, or other financial instrument has reached a peak price level twice with a moderate decline between the two peaks.
- The double-top pattern forms when an asset's price rises to a resistance level, declines, and then returns to the same resistance level before falling again. The two peaks should be approximately equal in height, and the decline between them should be noticeable but not necessarily large.
- The pattern is confirmed when the price breaks below the support level (the lowest point between the two peaks), often referred to as the "neckline." A break below this level indicates a potentially significant drop in price, confirming the bearish trend.
- Volume is crucial for confirming the double top pattern. Typically, volume is higher on the first peak and lower on the second peak. Increased volume during the decline after the second peak further validates the pattern.
Trade Setup with a Double Top formation
Specific requirements must be followed to ensure that any pattern generated on stock charts is authentic and accurate. For example, the following conditions must be met for the double-top design.

- Prior Trend: Any reversal pattern needs an existing trend to change to occur. A significant uptrend should be in place during the double-top reversal.
- First Peak: The current trend's highest point is the first peak of the double-top pattern. This point will later act as the resistance level for the design.
- Trough: Following the first peak, there is often a 10–20% decrease. The volume on the drop following the initial high is typically insignificant. Sometimes the lows are slightly rounded or drawn out, which may indicate a lackluster demand.
- Second Peak: After hitting the trough, the stock price rises again. This rise from the channel usually occurs with a modest volume.
- The interval between the two peaks (if we observe the pattern on a daily chart) should be at least two weeks. While perfect mounts are preferred, there is some leeway; a peak within 3% of its predecessor is usually accepted.
- Peak Decline: After hitting the peak level for the second time, the stock rebounds again, and the price of the underlying declines. Also, the dip is accompanied by more significant volumes and accelerated descent this time.
- Neckline Break: The double-top is still in progress even after the price has moved to the neckline. The neckline is the price level of the trough in between the two peaks. The pattern is complete when this neckline is broken with a rise in volume and speed.
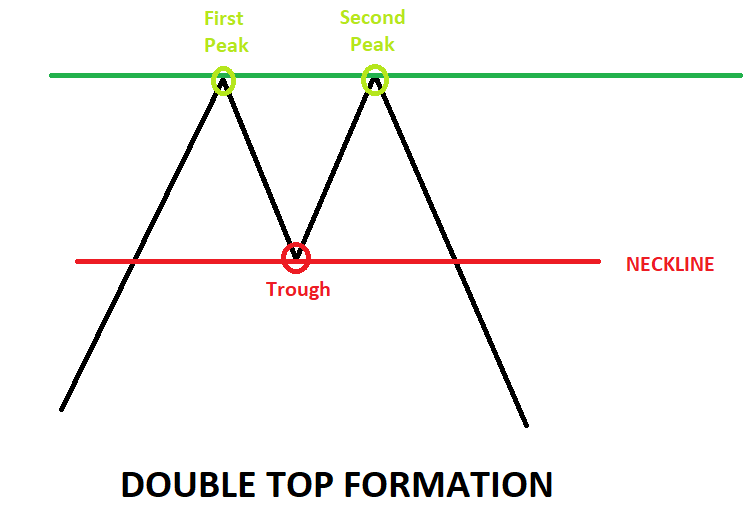
Below is a visual representation of a double-top pattern formation
The green arrow indicates a prior trend (uptrend). The peak of this uptrend (P1) is our first peak.
After hitting the first peak, the price of the underlying declines, forming the trough (T). This point will later act as the pattern's neckline (represented by the red line).
After forming the trough, the price bounces back to the same level as that of P1 to start the second peak (P2).
After the formation of the second peak, the price declines again, this time with a more incredible speed and higher volumes. In some time, the price breaks the neckline. Hence, a double-top is confirmed. The black arrow represents the downtrend that follows.
Picking the right trade using Double Top Pattern
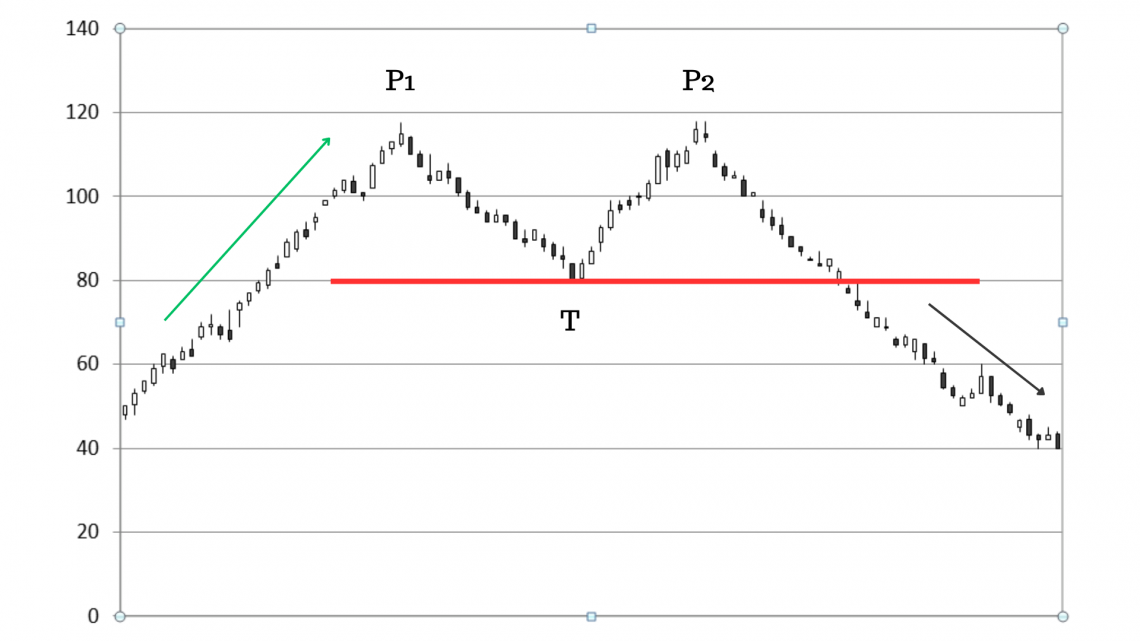
Let us now bring what we have learned into practical application and pick the right trade using a double-top formation on a stock chart.
The green arrow shows that the underlying asset is in an uptrend, and the stock makes the first peak at point P1. At P1, the price of this stock is nearly 118$.
After the peak, the price rebounded and formed a trough (T) at 80$. A red line in the chart has marked this price level. This line is a visual representation of the neckline formed by the double-top.
After forming the trough, the price of the underlying rose again. It again hit the same price point (nearly 118$), including the second peak (P2). Finally, after hitting P2, the price declined again and reached the same price level as the trough.
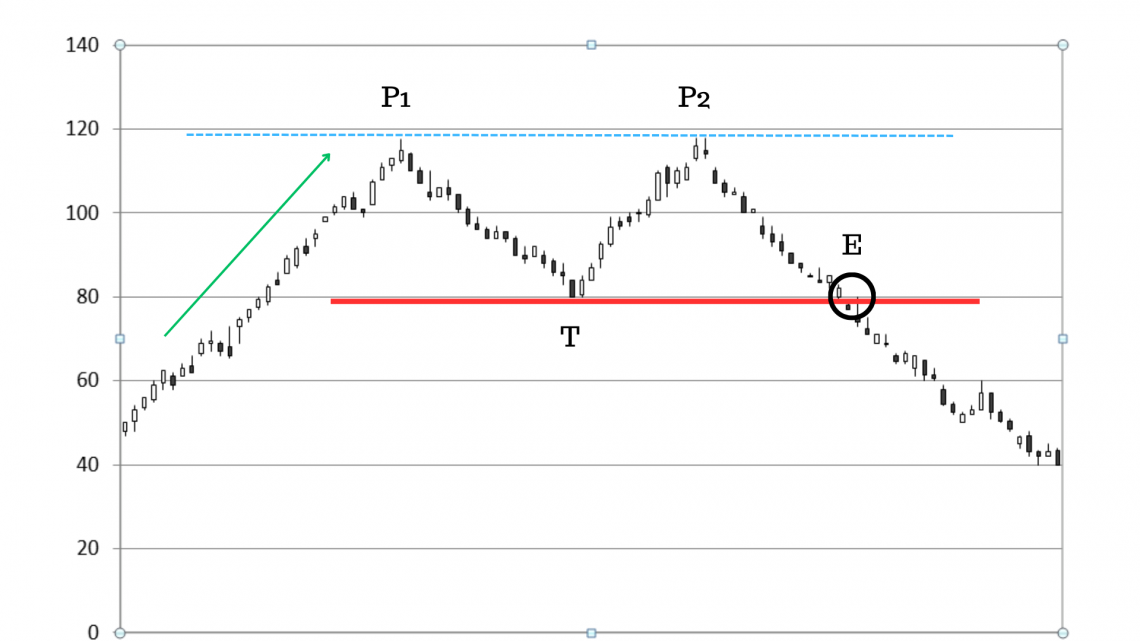
However, the double-top is complete only after the price breaks the neckline. At point E, we finally get an entry signal when the price breaks the neckline. Therefore, we can make the following trade setup:
- Entry: We enter when the price level breaks the neckline (this level has been represented by point E on the chart above). In this case, we initiate a short position at $80.
- Target: To estimate the target, add the distance from the neckline to the peak of the formation (this implies that the more significant the building, the greater the potential decline).
In our scenario, this distance is 118 - 80 = 38 points. Therefore, the target is 80 - 38 = $42.

As you can see, we comfortably reached our targets. On initiating a short-sell, the trader would have made a profit of 38$ per share.
Limitations of Double Top Formation
While double tops can be a valuable tool for traders, traders should be aware of some limitations to this pattern.
1. Ambiguity
Double tops can sometimes be ambiguous. Sometimes, it may be challenging to determine whether a pattern is a double top or just random price fluctuations. It can lead to confusion and potentially incorrect trading decisions.
One reason for this ambiguity is that double tops are a subjective pattern. Despite having a well-defined basic structure, a double top can have variations in the precise locations of the two peaks, the time between them, and the depth of the trough.
It can make it difficult for traders to determine whether a pattern meets the double-top criteria.
2. False Signals
One of the main limitations of double tops is that they can sometimes produce false signals. For example, the price may form two peaks at roughly the same level, but the price does not decline after the second peak. In such cases, the pattern fails to confirm, and the price may continue to rise.
It can result in traders entering short positions based on the formation of the pattern, only to see the price continue to rise.
3. Limited applicability
Double tops are typically more effective in markets with lower volatility. In high-volatility markets, patterns may not form clearly, making it challenging to identify double tops.
4. Influence of Market Noise
Another limitation of double tops is that they can be influenced by market noise. Market noise refers to random price movements unrelated to any underlying fundamental factors. It can make it difficult to identify meaningful patterns in the price data.
Double Top FAQs

Yes, a double-top pattern can fail. While a double-top is a bearish reversal pattern, several factors, such as lack of sufficient buying pressure or a significant fundamental change affecting the underlying asset, can cause the way to fail.
A triple-top formation is a bearish reversal pattern similar to a double-top but with three peaks instead of two.
When the price of an asset rises to a certain level, declines rises again to the same level, rebounds downwards again, and then rises to the same level for a third time before eventually breaking below the support level, a triple-top pattern is established.
The inverse of a double-top pattern is called a double-bottom pattern. While the double-top pattern signals a potential reversal of an uptrend, the double-bottom pattern signals a possible reversal of a downtrend.
The double bottom pattern consists of two consecutive lows that are roughly equal, followed by a breakout above the high that separates the two lows.

Free Resources
To continue learning and advancing your career, check out these additional helpful WSO resources


or Want to Sign up with your social account?