Fibonacci Retracements
A technical analysis tool that traders and investors use to pinpoint probable levels of support and resistance in a price trend on financial markets like stocks, commodities, and foreign exchange.


What are Fibonacci Retracements?
Fibonacci retracements are a technical analysis tool that traders and investors use to pinpoint probable levels of support and resistance in a price trend on financial markets like stocks, commodities, and foreign exchange.
It is based on mathematical ideas called the Fibonacci sequence and the golden ratio.
Fibonacci retracement levels are calculated using ratios to locate possible reversal points on a price chart. The most common are 61.8% and 38.2% Fibonacci retracements.
These ratios are derived from mathematical relationships within the Fibonacci sequence and are widely utilized in financial analysis.
Notably, 61.8 is frequently rounded to 62%, while 38.2% is frequently rounded to 38%. Chartists employ Fibonacci ratios to ascertain the expected retracement levels following price advances, enabling them to make informed predictions about the extent of a correction or pullback.
The Fibonacci concept was created by the Italian mathematician Leonardo of Pisa.
- Trading professionals utilize Fibonacci retracements to plot support and resistance lines, pinpoint price levels for stop-loss orders, and create target prices.
- A Fibonacci retracement is produced by dividing the vertical distance between two extreme points on a stock chart by important Fibonacci ratios, including 23.6%, 38.2%, 50%, 61.8%, and 100%.
- Fibonacci retracement levels are considered a form of technical indicator as they aim to forecast potential future price positions.
- It is risky to believe that the price will turn around once it reaches a particular Fibonacci level because these levels shouldn't be depended on completely.
Understanding Fibonacci Retracements
Fibonacci retracements are a popular tool among technical traders, aiding them in identifying opportune entry points, setting stop-loss orders, and determining target prices for their trades.
The tool's central tenet is that the most significant breaks or bounces might occur at the support and resistance levels for a currency pair trend. These lines are frequently seen where fresh support and resistance levels are found following a large price movement (upward or downward).
The prices at Fibonacci retracement levels are constant, unlike moving averages. Traders and investors can respond when price levels are tested, thanks to the quick and straightforward detection made possible by this.
Since these levels mark inflection points, traders anticipate either a break or a rejection of the price. The golden ratio corresponds to the 61.8% (0.618) Fibonacci retracement that financial analysts frequently employ.
Prices frequently retrace a sizable percentage of the prior trend before continuing to move in the original direction, depending on whether the market is moving up or down.
Fibonacci retracement levels often serve as parameters that capture these countertrend swings, making them a valuable tool for traders seeking to navigate the complexities of financial markets.
Uptrend Fibonacci Retracement
Fibonacci retracement is a useful technique for traders to locate probable support levels during an uptrend. Traders create Fibonacci retracement levels based on a recent major price move when an asset's price is rising.
These levels, including 38.2%, 50%, and 61.8%, are thought to represent possible locations where the price may retrace before continuing to rise. It may be inferred that the uptrend will likely continue if the price retraces to one of these levels before starting to climb higher once more.
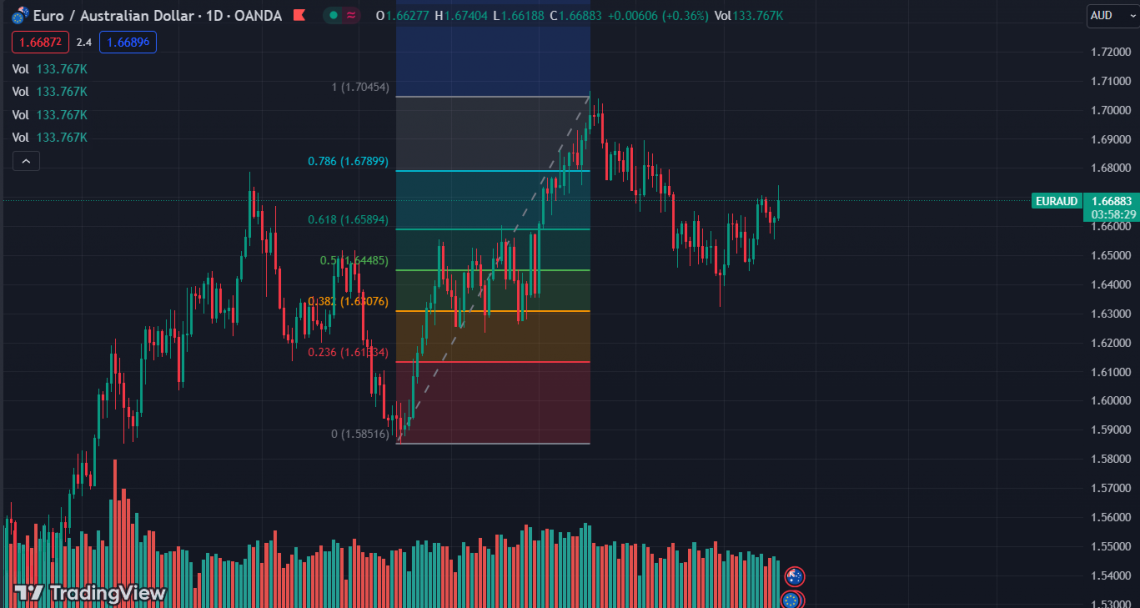
Here’s a chart with a Fibonacci retracement. Price was in an uptrend, and then it pulled back and retraced at the 50% line, which is the green line.
This level acted as support for the price, signifying a point where buyers were willing to step in. This kind of retracement often indicates that the uptrend is still intact and likely to continue.
Downtrend Fibonacci Retracement
Fibonacci retracement, on the other hand, can be used to find probable resistance levels in a downtrend. Traders create Fibonacci levels based on a large price loss when an asset's price is declining.
These levels could act as possible roadblocks where the price could stop or turn around before continuing its downward trend. It may be a sign of a probable trend reversal or the continuation of the downtrend if the price retraces to a Fibonacci level and finds it difficult to go past it.
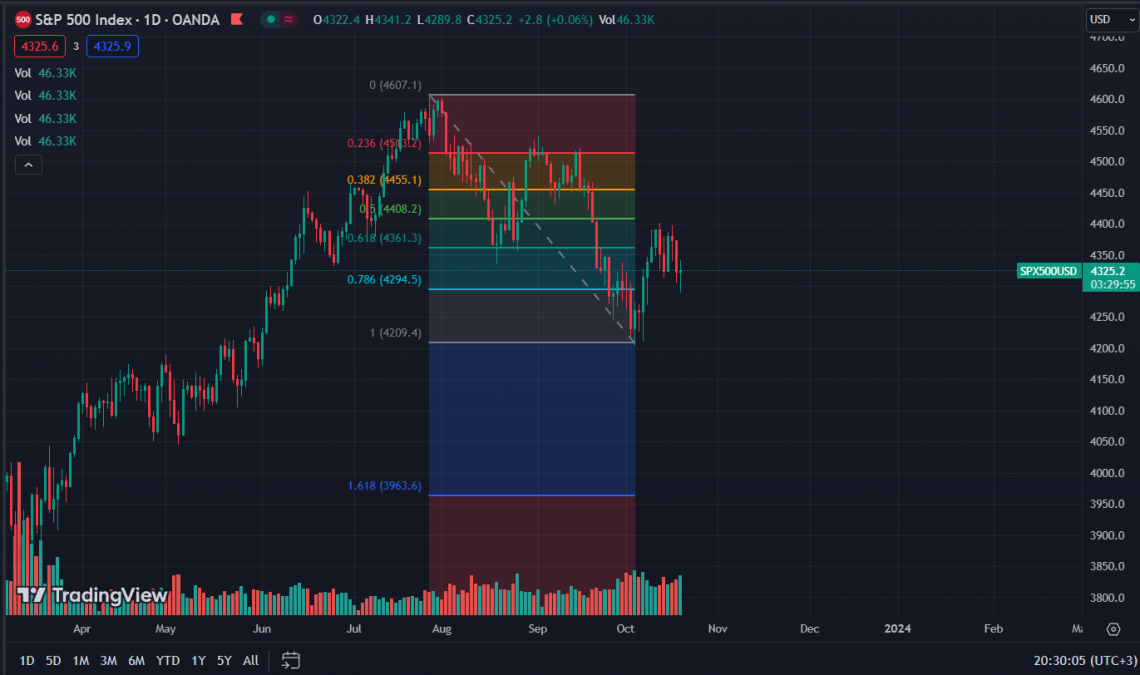
For instance, in the chart provided, there is a clear downtrend observed on the daily chart. The price initially pulled back and retraced to the 61.8% Fibonacci level, which is often considered a resistance point.
This level acted as a significant barrier, where sellers regained control, preventing the price from moving higher.
Fibonacci Formula
Formulas for Fibonacci retracement levels are not available. The user selects two points before applying these indicators to a chart. Subsequently, lines are drawn on the chart at certain percentages of the move between those two selected points.
Let's say the price increases from $40 to $44, and the retracement indicator is drawn at these two price levels. The 23.6% line will be located at ($44 - ($4 * 0.236) = $43.056). The 50% level will be at ($44 - ($4 * 0.5) = $42), the 50% level.
These numbers are well known for their connections to the Golden Ratio and the fact that they appear frequently throughout mathematics, science, art, and nature.
Fibonacci numbers are used by traders in technical analysis of the financial markets to identify likely support and resistance levels.
Fibonacci Numbers
The Golden Ratio serves as the foundation for the Fibonacci number series. This sequence begins with the first two numbers, which are one and zero. Each subsequent number in the series is obtained by adding the two preceding numbers.
The Fibonacci numbers are as follows.
0; 1, 2, 3; 5, 8; 13, 21; 35; 55; 89; 144; 233; 377; 610; 987; and more
The Fibonacci retracement levels are all calculated using these numbers. The result of dividing one number by the one after it in the sequence is 0.618, or 61.8%.
The answer is 0.382 or 38.2% when a number is divided by the next number to the right. Except for 50% (which is not a recognized Fibonacci number), all ratios are based on calculations employing this sequence of numbers.
What matters is that as the numbers increase in size, the ratio between each subsequent pair of Fibonacci numbers approaches 1.618, or its inverse, 0.618.
Fibonacci Retracement Levels: What They Reveal
Retracement levels can show traders a potential trend reversal or a potential resistance or support level. Retracements are calculated using the preceding move.
While a correction is anticipated to retrace some of the earlier increases, a bounce is anticipated to retrace some of the past declines.
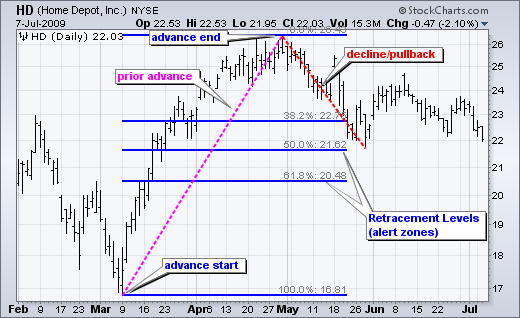
Chartists can pinpoint certain Fibonacci retracement levels to watch whenever a pullback begins. Chartists should be on the lookout for a potential bullish reversal when the downturn reaches these retracements. In the chart above, Home Depot is retracing around half of its recent advance.
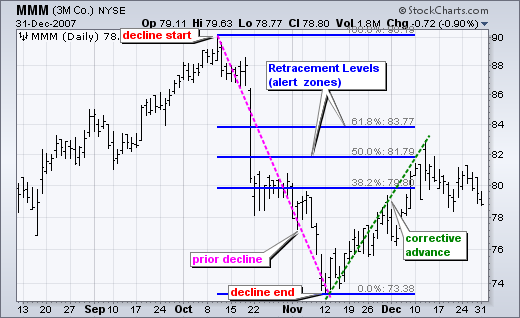
For a rebound or corrective advance following a decline, the opposite is true. Chartists can pinpoint certain Fibonacci retracement levels for monitoring after a rally starts.
Chartists should be on the lookout for a potential bearish reversal when the decline gets closer to these retracements. The chart below demonstrates how much of the prior loss in 3M has been retracted.
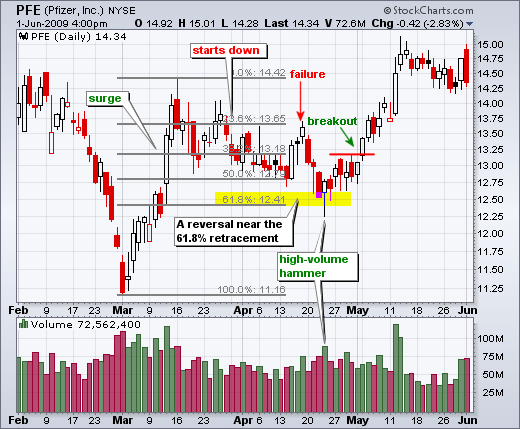
Remember that these retracement levels do not signify a firm turnaround. Instead, they act as warning areas in case of a possible reversal. At this stage, traders should use additional technical analysis techniques to spot or confirm a reversal.
Candlesticks, price patterns, momentum oscillators, and moving averages are a few examples of these.
According to the chart above, Pfizer bottomed off close to the 62% retracement line. There was a failed bounce close to the 50% retracement before this one was successful. The effective reversal started with a hammer on strong volume and was followed a few days later by a breakout.
According to the chart below, JP Morgan (JPM) peaked close to the 62% retracement level. Strong gains were made up to the 62% retracement. However, resistance quickly cropped up with a reversal confirmation from the MACD (5,35,5).
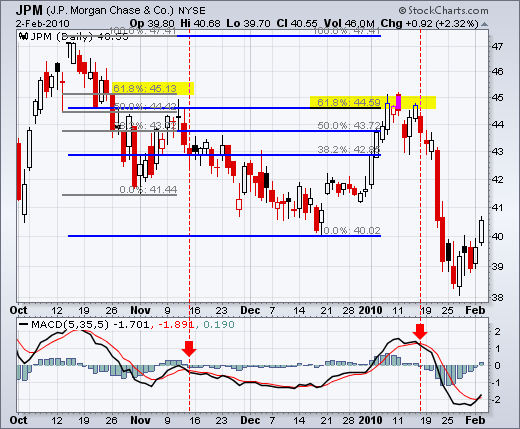
The gap down and red candlestick confirmed resistance close to the 62% retracement. After two days, there was a rise back over 44.5, but this rise was short-lived because the MACD fell below its signal line.
Conclusion
Fibonacci retracement levels are frequently utilized to spot the conclusion of a decline or a bounce in the opposite direction. Retracements of previous price movements are commonly observed during market corrections and counter-trend bounces, providing traders with important information.
Even though there are brief 23.6% retracements, the 38.2-61.8% range contains the majority of potential outcomes (with 50% in the middle). Although this area appears large, it is only a reversing alert zone.
Traders and investors frequently utilize the Fibonacci retracement, a popular technical analysis tool, to determine probable support and resistance levels in the financial markets.
To verify a reversal, further technical indicators are required. Candlesticks, momentum indicators, volume, and chart patterns can all be used to corroborate reversals. The signal is stronger the more confirming elements there are.
When choosing entry and exit positions, traders utilize Fibonacci retracement to help them understand market dynamics and maybe enhance their trading techniques.
Fibonacci retracement is just one of many tools used in technical analysis, and as such, depending on the state of the market and other variables, it may or may not be helpful.


or Want to Sign up with your social account?