Advanced Technical Analysis
It refers to using multi-technical indicators or methods that specialize in predicting market movement.


What is Advanced Technical Analysis?
Technical analysis is a way of assessing the price action over a specific period. Market prediction is difficult, but charts come in handy when predicting market direction. By 'advanced,' we mean using multi-technical indicators or methods that specialize in predicting market movement.
Technical analysis deals with the basics of chart reading, such as Candle Charts, patterns, Bollinger bands, moving averages, and Relative Strength Index.
These and other technical indicators help determine how a price chart will move in the future. As a result, HFT firms primarily rely on charts and analyze data using these techniques.
A hardcore technical analyst has to analyze various parameters before making his bet. We will dive into those "advanced" techniques. Nevertheless, let us familiarize ourselves with the basics of technical analysis.
So, we are comfortable with terms such as Hammer, Inverted Hammer, bullish engulfing, and similar words. So let us take a stride and learn a few times that institutional investors use and which most retail investors are unfamiliar with.
A word of caution learning about these sophisticated terms does not necessarily unlock the doors to wealth because there are real people making investment decisions that can not be analyzed using mere charts. Nash equilibrium plays an important role here.
Nevertheless, it does give us an edge over markets and increases our prospect of making a successful trade.
- Heiken Ashi technique offers a smoother representation of price movements by averaging data. It can help reduce market noise and provide clearer signals for trend analysis.
- Pivot points help identify key support and resistance levels, aiding in decision-making for entry and exit points. They can be useful for both trend identification and breakout trading strategies.
- Ichimoku Cloud is a complex indicator that combines multiple technical elements to provide a comprehensive view of market conditions at a glance. It includes various lines and spans that offer insights into trend direction, support, and resistance levels.
- A double bottom pattern indicates a potential reversal in a downtrend, suggesting a shift towards an uptrend. It's characterized by two consecutive troughs at approximately the same level, followed by a breakout above the pattern's neckline.
Advanced Technical Analysis technique - Heiken Ashi
With the Heikin-Ashi technique, price data is averaged to produce a Japanese candlestick chart that removes market noise. Munehisa Homma developed it in the 1700s.
As opposed to standard candlestick charts, Heikin-Ashi charts use a formula based on two-period averages instead of open, high, low, and close.
The Heikin-Ashi Formula is
- Close = (Open + High + Low + Close)/ 4
- Open = (Open of Prev. Bar + Close of Prev. Bar)/ 2
- High = Max [High, Open, Close]
- Low = Min [Low, Open, Close]
Heikin-Ashi chart
In Heikin-Ashi's chart, down days are represented by filled candles, while up days are represented by empty candles. We have used colored charts for more vivid presentations. The significant difference between Heikin-Ashi and the standard chart is that Heikin-Ashi essentially takes an average movement.
- To make the first HA open, combine open and close.
- This period's high and low are the first HA high and low.
- It is feasible to continue computing the HA candles according to the formulas after calculating the first HA.
- Use the previous period's open, high, low, and close to compute the next.
- Use the previous open and close to add the following open.
- Choose the max of the current period's high or the current period's HA open or close to adding the next high.
- To determine the following low, choose the maximum of the current period's low or the current period's HA open or close.
- The opening and closing of the HA differ from the period.
Limitations
The limitations of the Heikin-Ashi technique are:
- Time latency: Because the Heiken-Ashi indicator's essential signals are based on historical prices, there is a time lag.
- No use of price gaps: Most traders do not use price gaps to monitor price momentum, trigger entry, or place stop-loss orders. Although Heikin-Ashi lacks price gaps, traders can overcome this drawback by momentarily shifting to standard candlesticks during a trading session.
- No complete price information: Heikin-Ashi data is averaged; Therefore, actual open and close prices are not shown. This may not be the best strategy for day traders or scalpers who trade more active securities.
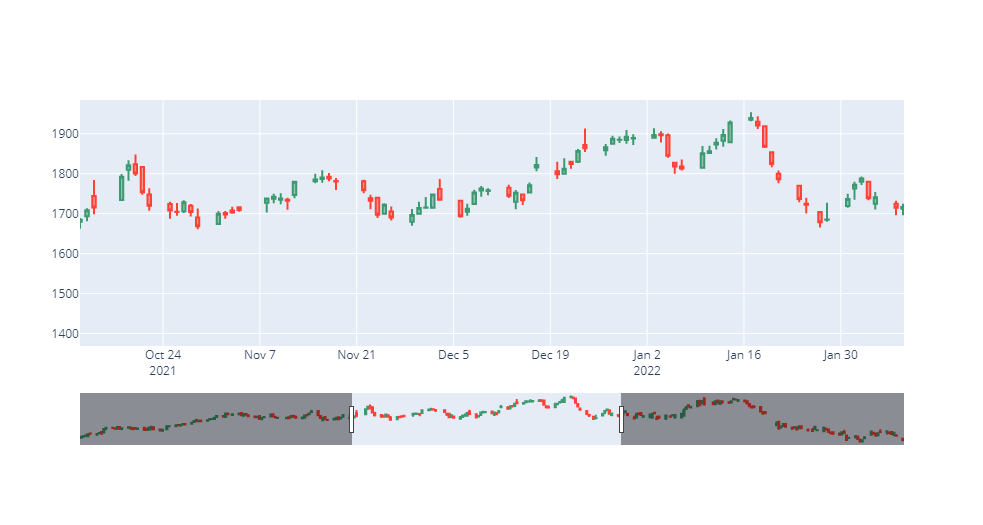
Advanced Technical Analysis technique - Pivot points
Calculating the pivot point indicates the direct support and resistance where the most significant price change is likely at this price. The other support and resistance levels are less powerful but can still trigger price changes.
Calculating Pivot Points
- Pivot Point = (Previous High + Previous Low + Previous Close ) / 3
- Support 1 (S1) = (Pivot Point ∗ 2) − Previous High
- Support 2 (S2) = Pivot Point − (Previous High − Previous Low)
- Resistance 1 (R1) = ( Pivot Point ∗ 2 ) − Previous Low
- Resistance 2 (R2) = Pivot Point + (Previous High − Previous Low)
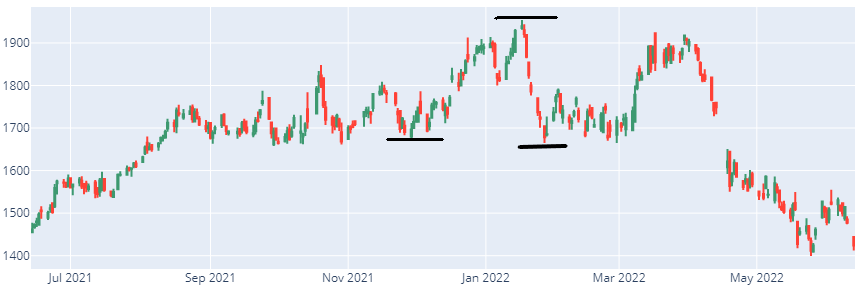
Support and resistance
While pivot points are calculated to help spot crucial resistance and resistance levels, support and resistance are based on more subjective placements to help spot potential breakout trading chances.
Support and resistance lines are a theoretical construct to explain traders' seeming unwillingness to push an asset's price beyond particular thresholds.
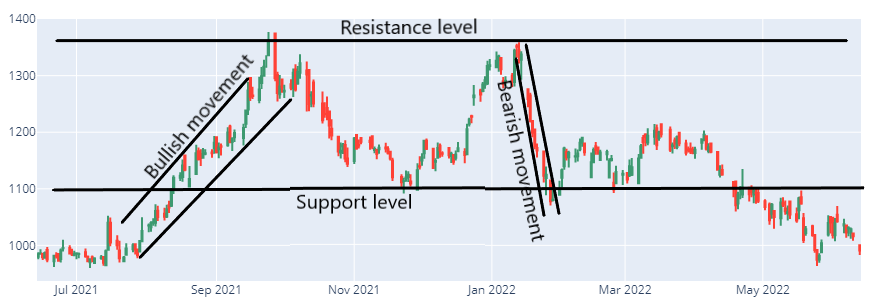
Bull trading is said to have met resistance when it looks to advance to a steady level before pausing and retracing/reversing.
When bears trade close to a given price point and then steadily move upwards again, they are said to have met support. Prices breaking through specified support/resistance levels are seen as an indication of new trends developed by traders.
Pivot points in use
The first step is to establish the market's overall trend. The market is bullish if the pivot point price is broken in an upward movement. Conversely, it is bearish if the price declines through the pivot point.
The second method uses pivot point price levels to enter and exit the markets. A trader might, for example, place a limit order to buy 20 shares if the price breaks through a resistance level.
A trader could also put a stop loss at or near a support level using pivot points.
Advanced Technical Analysis Technique - Ichimoku Cloud
At first sight, the Ichimoku Cloud, which incorporates a collection of technical indications, may appear difficult or overly complex.
A Japanese news reporter created it. Because it vividly depicts the market when placed on a chart, users of the Ichimoku Cloud refer to it as a "one-glance" indicator.
The red line represents the Tenkan Sen in the chart below. The Tenkan sen measures the average of the highest high and lowest low over the previous nine periods.

Using the Ichimoku daily chart, the Tenkan line represents the high/low average for the last nine days.
Because of its design, the cloud is more responsive to price action than a standard nine-period moving average: It is not the average of the high and low of each period, as a simple moving average is, but the average of the highest high and lowest low recorded throughout the whole nine-period time frame.
The Kijun Sen is the light blue line. The Kijun Sen indicator line has taken longer to signal a market move over the last 26 periods.
The Kijun sen indicates the average of the highest high and lowest low. Because it is perceived as signaling close support or resistance, the Kijun line is commonly used to determine where to put an initial stop-loss order when initiating a trade.
The average of the highs and lows of the Tenkan-Sen and Kijun-Sen is shown 26 periods to the right as Senkou Span. The Senkou span A is represented as an orange line on a chart.
Senkou span B was determined by plotting the average of the previous 52 periods' high and low values 26 points to the right.
A green line indicates the Chikou Span, also known as the trailing span. It is made by changing the current price 26 periods to the left.
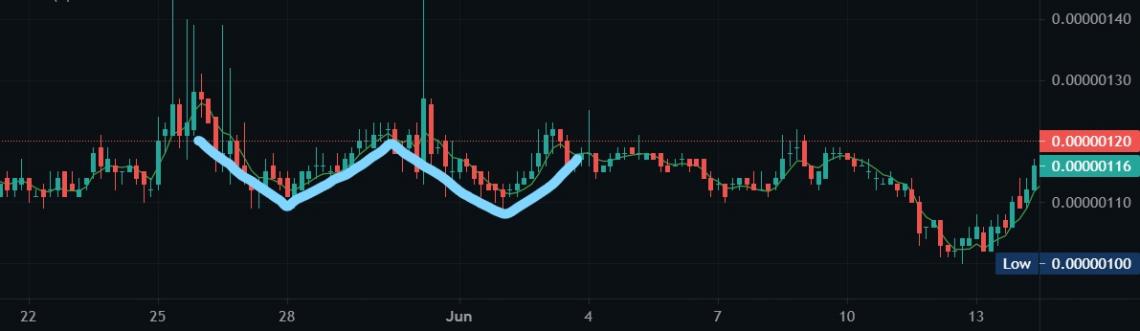
Advanced Technical Analysis Technique - Double Bottom
A double bottom pattern is a technical analysis charting pattern that indicates a shift in the trend and a reversal of momentum from prior leading price movement.
It represents a stock or index dropping, rebounding, dropping again to the same or comparable level as the previous decline, and then rebounding again. The double bottom resembles the letter "W."
A support level is defined as a low that has been touched twice. Most technical analysts anticipate that the first bottom should decline by 10% to 20%. Then, within 3 to 4% of the previous low, the second bottom should form, and the volume of the subsequent gain should increase.
A significant or minor downtrend in security is always followed by a double-bottom pattern, which predicts a reversal and the start of a potential upswing. As a result, market fundamentals for safety, the sector to which the security belongs, and the market as a whole should support the pattern.
The fundamentals should indicate the characteristics of a market condition reversal that is about to occur. The volume should also be closely checked during the creation of the pattern. Contrary to expectations, double-top designs are the polar opposite of double-bottom ways.
Stacking two spherical tops on top creates a double-top pattern. The first rounding top has an upside-down U form. Rounding tops may signify a bearish reversal because they typically occur after a long bullish run. Double tops will yield similar conclusions.
Advanced Technical Analysis technique - Gartley Pattern
The Gartley pattern is a harmonic chart pattern that helps traders pinpoint reaction highs and lows. It is based on Fibonacci numbers and ratios. In 1935, H.M. Gartley created the groundwork for harmonic chart patterns in his book Profits in the Stock Market.
The most popular harmonic chart pattern is the Gartley pattern. According to harmonic patterns, Fibonacci sequences can generate geometric pricing structures, such as breakouts and retracements.
The Fibonacci ratio is found in nature and has become a popular topic for technical analysts who utilize tools like Fibonacci retracements, extensions, fans, clusters, and time zones to study it.
The Gartley pattern is frequently used in conjunction with other chart patterns or technical indicators by technical analysts.
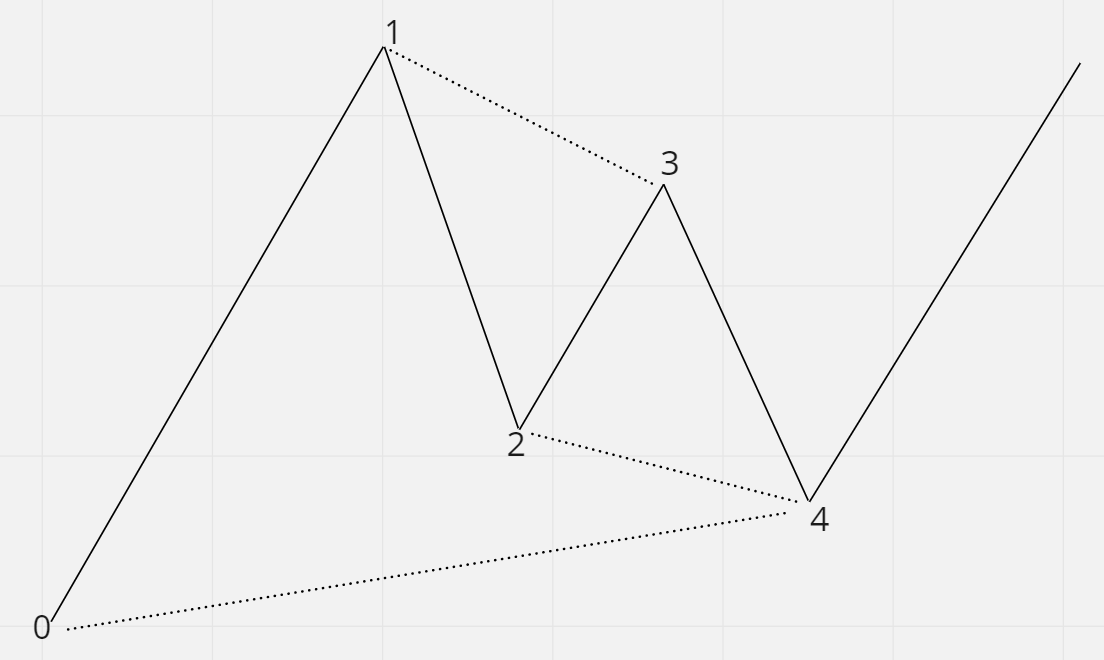
12: The 12 move should be approximately 61.8% of the 01 sizes. The 12 moves should reverse price action if the XA move is bullish and reach the 61.8% Fibonacci retracement of 01 if the XA move is bullish.
23: The 23 move should then reverse the 12 moves. Likewise, the 23rd move should finish either on the 38.2% Fibonacci level or the 88.6% Fibonacci level of the preceding AB leg.
34: The 34 should be a reversal of the 23 moves. Therefore, since 23 represents 38.2% of 12, 34 should respond to the 127.2% extension of 23. Therefore, the extension of BC should be 34, which should be 88.6% of 12.
14: Then, there is the last rule for the Gartley pattern. When the 34 move is complete, you should measure the 14 moves. Valid Gartley on the chart will show a 14 move, which takes a 78.6% retracement of the 01 moves.
Conclusion
Heiken Ashi, Pivot Points, Ichimoku Cloud, Double Bottom, and Gartley Pattern are examples of advanced technical analysis techniques that give traders comprehensive tools to examine market movements and make defensible conclusions.
A deeper understanding of price movement, trend direction, support and resistance levels, and possible reversal points are all made possible by these strategies.
However, traders should remember that no single strategy is infallible and that effective trading necessitates a blend of risk management, technical and fundamental research, and flexibility in response to shifting market conditions.
Furthermore, effort, perseverance, and ongoing education are necessary to master these sophisticated approaches. Trading professionals can increase their chances of success in the financial markets by incorporating these techniques into their tactics while upholding discipline and good judgment.
Advanced Technical Analysis FAQs
The four types are:
- Trend Indicators. Trend trading is a strategy for capturing profits by analyzing an asset's movement in a specific direction. Traders use trend trading indicators for these trade decisions.
- Momentum Indicators. Momentum indicators are techniques to identify a stock's high or weak price. The rate at which stock prices rise or decrease is called momentum. The relative strength index (RSI) and moving average convergence divergence are two popular momentum indicators (MACD)
- Volatility Indicators. Volatility refers to how frequently the price of an asset changes and to what extent it changes. While greater panic during significant market changes can offer buying chances and provide an exceptional trading ground for experienced investors, high volatility is typically a deterrent for a risky trade.
The Cboe Volatility Index (VIX), the actual average range (ATR), and Bollinger Bands are some of the most widely used measures for determining relative degrees of volatility. - Volume Indicators. Volume indicators are technical instruments to assess an asset's bull and bear power. Most analysts look to buying vs. selling pressure to establish which side is in charge of price activity. Others try to figure out what emotions are driving the security at any given time.
Successful investors do not only rely on a single strategy. They combine Fundamental analysis, Technical analysis, and instinct. Warren Buffet, one of the most successful investors, uses only fundamental research, but large trading firms use technical analysis while managing funds.
Many technical indicators have been produced, and traders continue developing new types to improve performance. For example, back-testing new technical indicators using historical price and volume data is common to evaluate how effective they would have been in predicting future events.
The MACD (Moving-Average Convergence/Divergence) line is the most popular technical indicator. Along with trends, it also indicates a stock's momentum.
The MACD line evaluates its short-term and long-term momentum to forecast a stock's future direction. Simply defined, it compares two moving averages, which can be configured for any desired period.

Everything You Need To Understand Python For Finance
To Help You Thrive in the Most Prestigious Jobs on Wall Street.
Free Resources
To continue learning and advancing your career, check out these additional helpful WSO resources:


or Want to Sign up with your social account?