Heikin-Ashi Technique
A technical indicator used to better understand market trends and forecast price movements.


What is the Heikin-Ashi Technique?
The Heikin-Ashi technique is a technical indicator used to better understand market trends and forecast price movements.
Market noises are a nuisance while analyzing a security's price. Therefore, we need a better chart that filters out market noise while studying price changes.
Market patterns and directions are clearly illustrated without market noise, which aids in forecasting future price changes.
Heikin and Ashi are two Japanese terms used to describe average and balance. Because the trading strategy uses the security's average price, Heikin-Ashi (HA), Japanese for "average bar," is aptly titled.
Munehisa Homma, a Japanese rice merchant, developed the technique in 1700. This trading method helps traders determine when to keep a deal open, pause a trade, or determine if a reversal is about to occur.
Traders can change their positions accordingly to avoid losses or lock in a profit on the selected position by making the appropriate adjustments.
A modified formula based on two-period averages is employed by the method. Technical traders can more quickly recognize a trend by using this approach.
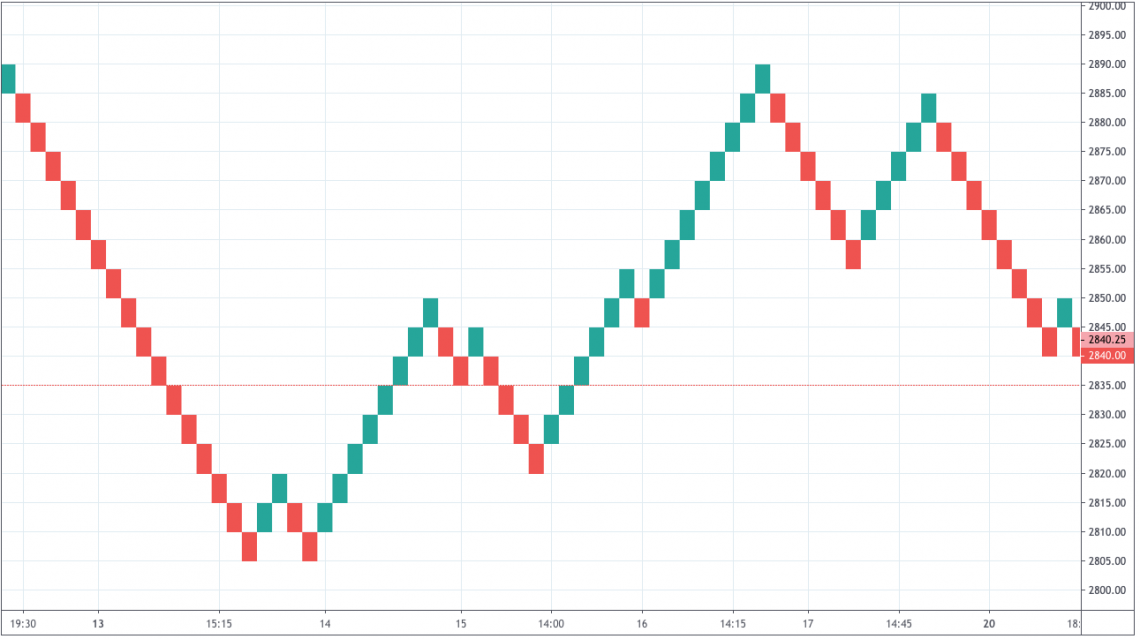
Strong uptrends are indicated by hollow white (or green) candles with no lower shadows, and strong downtrends by filled black (or red) candles with no upper shadow.
This smooths out the chart's appearance and makes it simpler to discern trends and reversals, but it also hides gaps and specific price data.
- The Heikin-Ashi technique is a candlestick charting method used in technical analysis to smooth out price data and make identifying trends and potential market reversals easier.
- Heikin-Ashi candles are calculated using a formula different from that of traditional candlesticks. They use averages for the open, close, high, and low prices, which helps reduce market noise and accurately reflects the trend.
- One of the main advantages of Heikin-Ashi is its effectiveness in identifying trends. Consecutive white or green candles typically represent upward trends without lower shadows.
- The Heikin-Ashi technique is often used with other technical analysis tools and indicators to confirm trends and make more informed trading decisions.
Constructing the Heikin-Ashi Chart
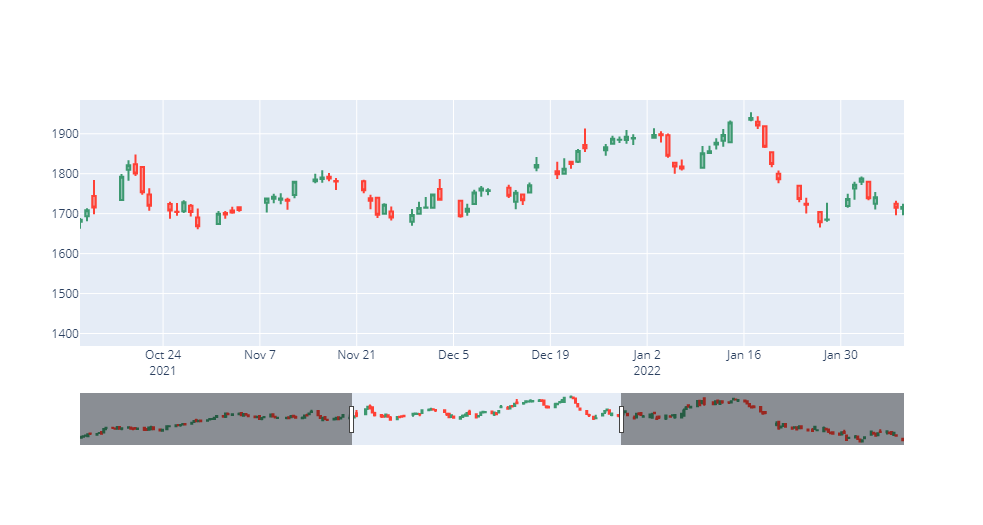
In this chart, down days are represented by filled candles, while empty candles represent the up days. The significant difference between this and the standard chart is that it essentially takes an average movement.
- To make the first HA open, combine open and close.
- This period's high and low are the first HA high and low.
- It is feasible to continue computing the HA candles according to the formulas after calculating the first HA.
- Use the previous period's open, high, low, and close to compute the next.
- Use the previous open and close to add the following open.
- Choose the max of the current period's high or the current period's HA open or close to adding the next high.
- Choose the maximum of the current period's low, or the current period's HA open or close, to determine the following low.
- The opening and closing of the HA differ from the period.
Formula for the Heikin-Ashi Technique
Below are the formulas for the Heikin-Ashi Technique:
Close = (Open + High + Low + Close)/ 4
Open = (Open of Prev. Bar + Close of Prev. Bar)/ 2
High = Max[High, Open, Close]
Low = Min[Low, Open, Close]
Heikin-Ashi Technique in use
This approach captures the trend now driving the market through indication signals. These indicator signals can be divided into trend strength and trend reversal.
Trend Strength
Measuring the trend's strength is the first consideration. However, minor consolidations and corrections might not be seen on the chart due to the indicator's smoothing effect.
Therefore, it is advised to utilize a trailing stop to increase the advantages of trading within the trend while using the Heikin-Ashi approach.
If the trend is strong, it is recommended that a trader continue to benefit from it. Several of these trends are explained below.
Bullish trend
Several successive green candlesticks without lower shadows are a significant indicator of an uptrend or bullish trend. Traders can invest more money or long their position and expect profits to rise until a bearish trend is observed.
Bearish trend
Many successive red candlesticks without upper wicks display a strong downturn signal. This is when traders are expected to short their positions or sell their securities as the bear market will presumably prevail.
Triangles
There are three HA triangles: symmetrical, ascending, and descending. The upswing will likely continue if the indicator crosses above the upper boundary of an ascending or symmetrical triangle.
The negative trend will continue and intensify if candles fall below the descending triangle's bottom line.
Change in Trend
A trend reversal signal can aid in deciding when to exit a prior trend-following trade and begin a new career. Losses can be prevented by entering a new business when a reversal indication is spotted.
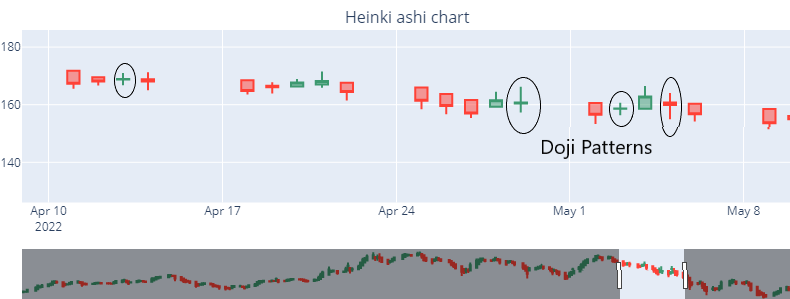
Doji candlestick
The Doji candlestick pattern is formed when a security's opening and closing prices are almost identical.
All types of investors value this candlestick pattern's adaptability to various time frames.
When the market starts, bullish traders drive prices upward, while bearish traders reject the higher price and push it back down, forming this candlestick.
It's also possible that bullish traders fight back and raise prices while bearish traders attempt to drive prices as low as they can.
The wick is created by the upward and downward movements between open and close. The body is created when the price closes at the same level as it opened or very close. The HA Doji candle indicates a trend reversal in financial markets.
Wedges
There are two forms of wedges: rising and falling. Wedges resemble triangles a little more. A trader using a rising wedge indicator must wait until the candlestick crosses below the bottom line of the hand.
If a falling wedge is seen, a trader should watch for a price breakout over the upper line, which will cause the downward trend to cease.
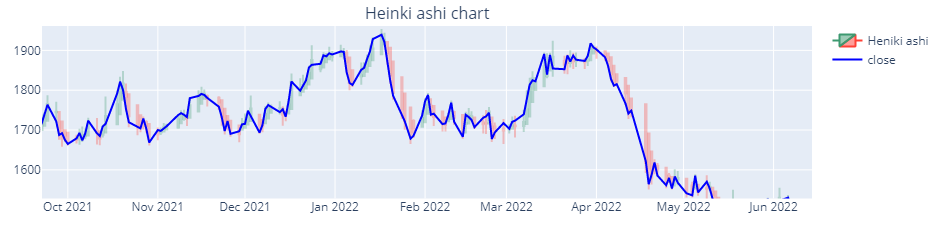
Example Using Heikin-Ashi Candlesticks
A long green HA candlestick indicates intense purchasing pressure over a given period. Small candlesticks or those with long upper and lower shadows indicate hesitation, while the absence of a lower shadow shows strength.
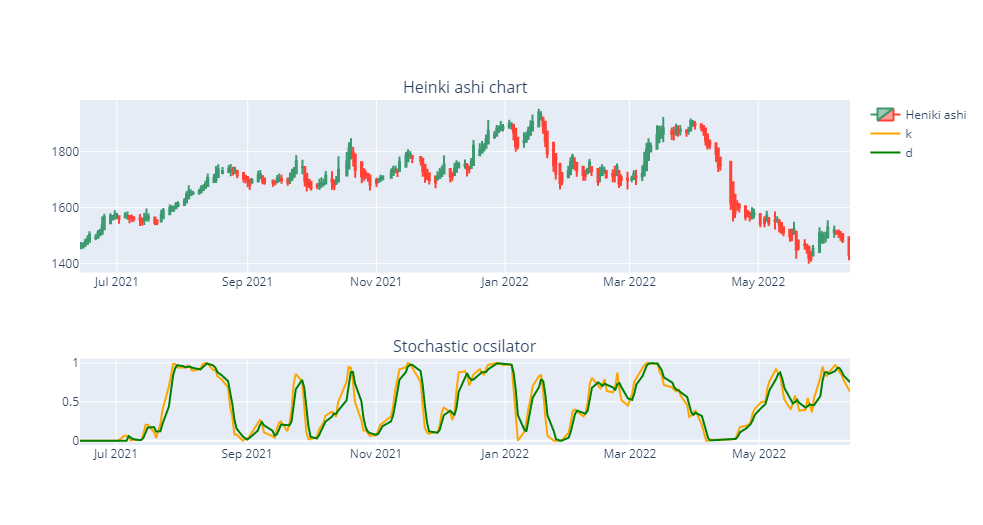
We can use many indicators with it, but the most efficient trading strategy adds stochastic techniques.
An effective trading indicator for foreseeing trend reversals is the stochastic oscillator, sometimes referred to as the stochastic Indicator.
This Indicator also emphasizes price momentum and can be used to spot overvalued and undervalued investment assets, including shares, indices, currencies, and many others.
The stochastic oscillator gauges the momentum of price fluctuations. The pace of acceleration in price movement is known as momentum.
The stochastic Indicator's premise is that an instrument's price momentum will frequently change before the instrument's price movement changes direction. Therefore we can use to foresee trend reversals using this Indicator.
HA and the stochastic Indicator are combined to create a trading strategy, which we will elaborate on in the next paragraph.
1. Entry
Stochastic (14/3/3): Stochastic must score at least 50 points.
Stochastic (50/3/3): Stochastic needs to score higher than 50.
HA: A green HA candlestick without a lower shadow is ideal.
SMA(20): The candle's closing should be higher than the SMA.
Where 14 and 50 are periods for the K line and 3 indicates SMA for three time periods
2. Exit
One can exit profitably in numerous ways, such as using the stochastic Indicator at an angle of 85, a red candle, or prices below the 20-day moving average. However, the trailing stop loss to the previous candle's low is the most intriguing part of HA trading.
3. Sell Signal
Stochastic (14/3/3): Stochastic must not exceed 50 points.
Stochastic (50/3/3): Stochastic values should be under 50.
HA: A red HA candlestick without an upper shadow is appropriate.
SMA(20): The candle's closure should be beneath the SMA.
Benefits of the Heikin-Ashi Technique
Advantages of the technique are:
- Accessibility: It is one of the most easily accessible indicators because it doesn't need to be installed and is available on all trading platforms.
- High chart readability: Any trader may understand the candlestick patterns, making the chart simple to interpret. It is simpler to discern market patterns and movements because HA candlesticks are more straightforward to comprehend than typical candlestick charts.
- Reliable: It is a highly dependable indicator that produces accurate readings. It makes use of historical data, which is immune to biases.
- Filtering of market noise: The Indicator ignores minor adjustments and filters out market noise, resulting in more visible signals. The smoothing effect facilitates trend identification. Today's markets are noisy. This technique allows traders to plan their entry and exit locations more effectively through noise reduction.
- Combinability with other indicators: To provide even more vital insights on market movement, the HA indicator can be used in conjunction with other technical indicators.
- Timeframe independent: This technique applies to all-time frames, including hourly, daily, monthly, and yearly ones. Larger time frames, however, are more dependable.
Limitations of the Heikin-Ashi Technique
Limitations of the technique are:
- A trade setup takes longer to create with this method since it uses price data from two periods. This is not a problem for swing traders who have the patience to let their transactions play out.
These charts, however, might not be responsive enough for day traders who need to take advantage of swift price movements.
- The averaged statistics can also hide vital price information. Many traders believe that daily closing prices are crucial. However, a HA chart does not show the actual everyday closing price; Only the averaged HA closing value is displayed to the trader.
- The trader must know the actual cost and the HA averaged to manage risk. Most traders utilize price gaps to assess price momentum, initiate trades, or place stop-loss orders.
Although Heikin-Ashi does not have price gaps, traders can get around this restriction by briefly switching to conventional candlesticks during a trading session.
Heikin-Ashi vs. Renko Charts
The Japanese invented the Renko chart, a type of chart constructed utilizing price movement rather than both price and predetermined periods as other charts are.
Given that the graph resembles a collection of bricks, it is named after the Japanese word for bricks, "renga."
Each brick is placed at a 45-degree angle (up or down) to the prior price changes by a predetermined amount. The standard color for an up brick is white or green, whereas a classic color for a down brick is black or red.
Heikin Ashi and Renko charts are smoother and less cluttered than typical candlestick charts, thanks to a few features. However, you must approach Heikin Ashi and Renko charts differently to learn how to interpret them.
Renko charts only display movements of a specific size, while Heikin Ashi charts average prices over a given period. This is known as the box size, and the brick can be any price, such as $10, $5, $20, and so on.
This implies that each period will have a fresh HA bar. While new Renko bricks are on a time axis, they are only connected to price movements of a specific magnitude and not a definite timeframe.
The same information is displayed differently in bar charts and candlestick charts. Due to the color coding of the price bars and thicker natural bodies, which are better at communicating the difference between the open and the close, candlestick charts are more illustrative.
Heikin-Ashi Technique FAQs
It is one of the most reliable technical indicators. It helps in identifying patterns by filtering out noise. That, however, does not imply that profits are guaranteed using only HA charts.
Amateur traders can combine the Heikin-Ashi and moving averages, Bollinger bands, and the Relative Strength Index (RSI). However, as mentioned above, combining stochastics and HA charts is proven effective.
HA charts are one of the most reliable and informative charts for short-term trading strategies, whether day trading or swing trading. It comes down to the trader's preference when choosing from the various advanced technical indicators available.
It smoothes out the classic candlestick by utilizing a modified formula, making a noticeable visual difference between itself and a traditional chart. The advantage of HA is that it makes charts easier to read and assists users in spotting and analyzing trends.
Heikin-Ashi candles are viable in the long term. For a trend-following approach, they produce a solid gain % and exhibit a modest drawdown. This is a crucial factor for many traders. Any plan that shows significant swings in profitability is challenging to implement.

Free Resources
To continue learning and advancing your career, check out these additional helpful WSO resources:


or Want to Sign up with your social account?