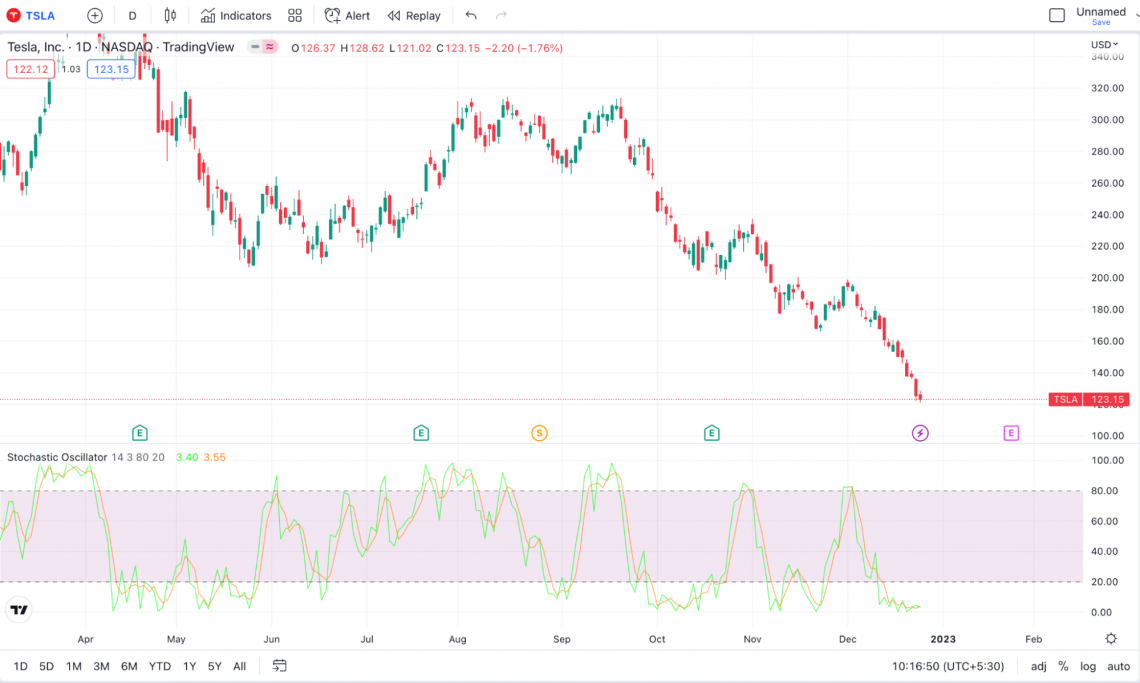
Stochastic Oscillator
A trading indicator that helps anticipate reversals in the direction of an existing trend.


What is a Stochastic Oscillator?
The stochastic oscillator, also referred to as the stochastic indicator, is a well-known trading indicator that helps anticipate reversals in the direction of an existing trend.
Additionally, it emphasizes price momentum and may be used to locate overbought and oversold levels in various financial assets, including shares, indices, currencies, and many others.
It does this by comparing the last traded price of an asset with its price range over a certain amount of time, which is generally 14 periods. The indicator is shown on the screen by two lines, the %K line and the %D line, which move from 0 to 100.
The momentum of market changes may be determined by using this indicator. The pace of acceleration in price movement is referred to as momentum.
This indicator is based on the hypothesis that the rate of change in the price of an instrument will frequently shift in its momentum before the rate of change in the instrument's price changes its direction.
Identifying possible turning moments in the market and confirming other technical analysis signals are possible applications for the stochastic oscillator.
For instance, if the line representing %K moves above the line representing %D, this may be seen as a bullish sign since it indicates that the asset is becoming oversold and may be ready for an upward reversal.
If, on the other hand, the line that represents %K drops below the line that represents %D, this may be seen as a bearish indication since it indicates that the security is becoming overbought and may be getting ready to make a downward turn.
Consequently, the indicator might be utilized to forecast trends' reversal.
- The stochastic oscillator is a momentum indicator used in technical analysis to compare a particular closing price of a security to a range of its prices over a specific period.
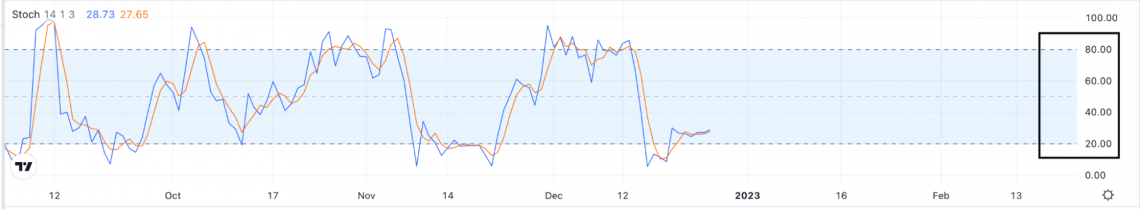
- The indicator consists of two lines: %K (the fast line) and %D (the slow line). These lines oscillate between 0 and 100, with readings above 80 indicating overbought conditions and readings below 20 indicating oversold conditions.
- The stochastic oscillator is often used in conjunction with other technical indicators to confirm trends and potential reversals. It provides insight into the strength and direction of price movements.
- The stochastic oscillator is commonly used by traders and analysts in various financial markets such as stocks, commodities, and forex due to its simplicity and effectiveness in identifying momentum shifts.
Understanding Stochastic Oscillator
The word "stochastic" describes a process that is decided at random and that may be examined statistically to conclude. One of the most widespread applications of stochastic models may be found in the world of finance and the stock market.
It is an essential aspect of technical analysis that may assist you in determining the price movement for an item such as a stock, a commodity, or a currency. You can use this indicator to help you determine price action.
The stochastic oscillator is one of the many technical stock market analysis indicators. However, it is one of the few indicators that are just as strong as the others.
Because it is range-bound, the stochastic oscillator is always in the range of 0 and 100. Because of this, it serves as a helpful gauge of overbought and oversold conditions.
Values under 20 are typically regarded as oversold, and values over 80 are in the overbought zone.
These do not, however, automatically portend an imminent reversal; strong trends have the ability to sustain overbought or oversold circumstances for an extended length of time. Traders could instead watch for variations in the stochastic oscillator as a clue about potential future adjustments in the trend.
History of Stochastic Oscillator
Dr. George C. Lane was an American trader and technical analyst who is most well-known for his work on the stochastic oscillator. This momentum indicator is widely utilized in technical analysis.
Lane was born in 1919, and in the 1940s, he started his career in the commodities trading industry. After some time, he developed an interest in technical analysis and started investigating the connection between market price and volume.
In the 1950s, Lane invented the stoch oscillator to assess the level of the close relative to the high-low range over a certain amount of time.
Values over 80 indicate that the security has been overbought, while readings below 20 indicate that it has been oversold. The indicator is represented on a scale from 0 to 100.
Lane thought that the oscillator might be used to determine the likelihood of a trend reversal or to validate the extent to which a trend was developing.
NOTE
Lane was well-known for his work on the stoch oscillator and his contributions to technical analysis.
He is the author of several publications on the topic, some of which include "The Stochastic Oscillator and Other Indicators" and "The Trading Ranges: A Beginner's Guide to Trading."
Lane died in 2003, but his work in the field of technical analysis continues to be extensively cited and regarded even after his passing.
Dr. Lane has been quoted as describing this indicator as such (Pruitt, 2016):
“It doesn’t follow price, it doesn’t follow volume or anything like that. It follows the speed or the momentum of price. As a rule, the momentum changes direction before price.”
Stochastic Indicator Formula
The indicator uses the following mathematical formulas to calculate the values.
1. K-line Formula:
%K = 100 x (CP – L14) / (H14 – L14)
Where:
- CP = the most recent closing price
- L14 = the lowest trading price of the asset in the previous 14 trading sessions
- H14 = the highest trading price of the asset in the previous 14 trading sessions
2. D-line Formula:
D = 100 x (H3/ L3)
Where:
- H3 = the highest trading price of the asset in the previous 3 trading sessions
- L3 = the lowest trading price of the asset in the previous 3 trading sessions

%K is the slow-moving indicator, and %D is a fast-moving indicator measured by the 3-period moving average of %K.
The asset price tends to close around its high when the market is trending higher, according to the indicator’s general thumb rule. Similar to how the market closes at its low point during a downtrend, the value will also be near its low point at market close.
The indicator combines the K and D line algorithms to spot unusual activity in the asset's price charts. The instrument handles these mathematical computations automatically since charting software has become more sophisticated recently.
Analysis of Stochastic Oscillators
Multiple oscillator values are combined to provide useful knowledge. Some have predetermined boundaries, while others may be tweaked per analyst preference. Take the following example into consideration:
- %K, also known as Fast Stochastic, is a number calculated to represent the most current value compared to the highest and lowest values that have occurred throughout the lookback period.
- Lookback Period is the number of prior periods used to calculate the k value; normally, 14 are looked back upon.
- The %D indicator, also known as the Slow Stochastic, is a trailing momentum indicator related to the k-values. It is used to smooth out trendlines and provide trading signals. Generates a Simple Moving Average (SMA), which typically has a duration of three periods, using K values as the input.
- The Overbought Line is the point at which the SO shows that the market as a whole is moving in a bullish direction. The default value is often 80, although it's also frequently set to 70.
- The Oversold line is the point at which the SO begins to imply that the market as a whole is heading downward. The default value is often set at 20, although it's also sometimes set to 30.
- Min/Max is the top and bottom of the SO chart, shown by lines showing the range of potential values for the SO, which is 0-100.
What does the Stochastic Oscillator indicate?
This indicator is used to detect overbought and oversold trading signals for any asset, which enables you to recognize reversals in the price movement. This indicator may be used to identify overbought and oversold trading signals for any asset.
If, for example, the value of the stochastic indicator for an asset is more than 80, then that asset is regarded as being in the overbought zone of the market. On the other hand, when the value is lower than 20, it is claimed that the asset has been oversold and is in this region.
However, the suggestion of overbought and oversold territory should not be seen as definitive proof of a reversal; rather, they should be viewed as hints to future price movements.
The stochastic chart consists of two lines:
- The first line displays the current value of the oscillator
- The second line represents the moving average of the first line's price over the last three days.
Trading signals are generated when the slower-moving stochastic line crosses the faster-moving moving average line.
These two lines move in sync with one another. Therefore, when the line representing %K crosses the line representing %D on an indicator chart, this might be interpreted as a reversal in the trend.
NOTE
It is essential to remember that the SO is only one of the numerous technical analysis tools available. Therefore, it should be used with other indicators and fundamental analysis to arrive at educated conclusions about financial investments.
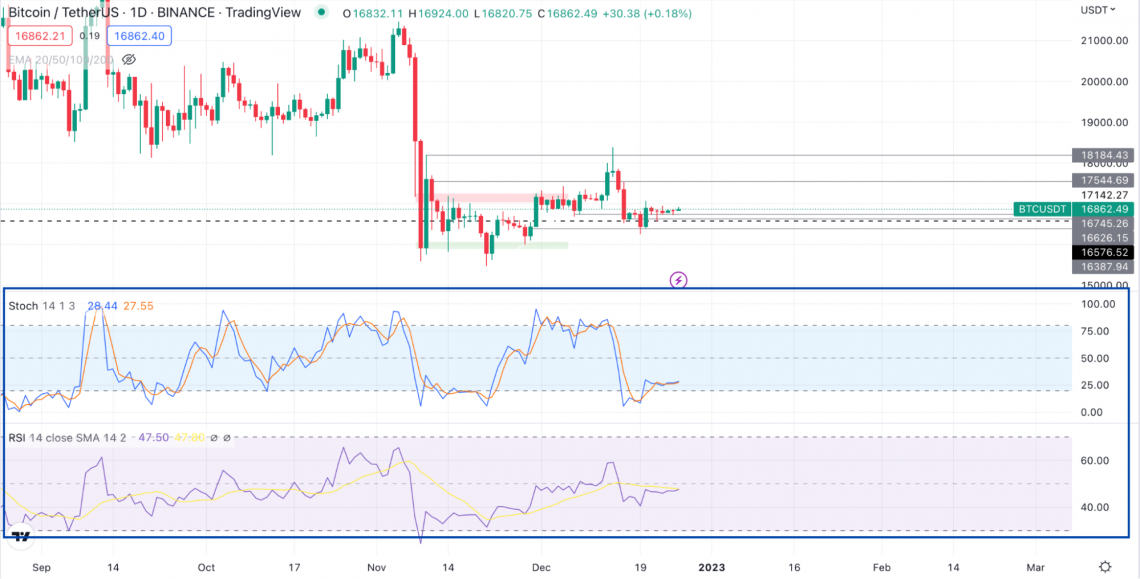
The Stochastic Oscillator's relation with the Relative Strength Index (RSI)
Another technical indicator somewhat comparable to the stochastic indicator is the Relative strength index (RSI). Each of these instruments is an example of a price momentum oscillator, and traders use both extensively.
Traders often combine the stoch oscillator with the relative strength index (RSI) to improve the reliability of a buy or sell recommendation. Although these two technical indicators may have a similar purpose, their underlying ideas couldn't be more different.
This indicator is based on the hypothesis that an asset's price tends to close near its highs when the market is trending upward and closes near its lows when it is trending downward.
On the other hand, the Relative Strength Index (RSI) calculates its value by analyzing the rate of change in the price of an asset.
When dealing with a market that moves in trends, the Relative Strength Index (RSI) may be a helpful tool for determining whether or not circumstances have become overbought or oversold.
Alternatively, the stochastic indicator is of more utility when the stock market moves in a choppy or choppy-like manner.
Trading with Stochastic Oscillator
The price of an asset is tracked by the stoch oscillator, which establishes a connection between the asset's final price and price range by moving in tandem with the price.
This indicator is now one of the most extensively used oscillators and is favored for its ability to anticipate market movements properly.
It is simple to comprehend, and with the assistance of certain up-to-date technological tools, the values of %K and %D may be simply calculated by any interested party.
Learning how to anticipate the market using this indicator can be useful if one of your goals is to become an active trader. This will allow you to recognize opportunities for trading better.
The following are some common applications of the stoch oscillator in the trading industry.
- Day trading
- Scalping
- Buy/sell confirmation
- Confirmation of overbuying and overselling
- Divergence
- The Daily Swing Method, in conjunction with the Admiral Pivot
NOTE
The Stoch Oscillator is based on the hypothesis that price follows momentum and evaluates an asset's closing price with a predetermined price range.
If you are developing a trading strategy based on this Stoch indicator, there are two things you need to keep an eye out for
- A warning that the trend is about to reverse
- Divergence
When the two lines in the oscillator chart meet, it is an indication that there may be an impending trend reversal due to a significant change in the day-to-day momentum.
Similarly, an increasing divergence between an oscillator and a moving price line might point to a potential shift in the trend that has been developing.
For example, if a bearish trend reaches a new lower bottom, but the oscillator maintains its position above the new price, this may indicate that bears are losing momentum and that a trend reversal may be on the horizon.
This indicator may be a useful trading tool if utilized properly and with prudence. If you don't want to risk losing hundreds or even thousands of dollars, be careful not to make any errors while using it to anticipate a transaction.
The following are examples of two novice errors that traders often make:
- Going long when the market is oversold, since the market may continue to collapse, resulting in an expensive miscalculation on your part.
- Thinking of any departure from the norm as a potential turnabout. Several situations may occur where the two indicators point in opposite directions; nevertheless, never a reversal occurs.
NOTE
Traders utilize this indicator in conjunction with other technical trading tools, such as the relative strength index (RSI), to help them avoid making errors.
When you cannot provide evidence of a trend reversal, the rule of thumb indicates that you should keep trading in the same direction as the trend and not trade against it.
Final Thoughts
The stochastic oscillator, like other indicators, may tell you when the price of an asset swings into the overbought or oversold territory by signaling when these zones are reached.
Alongside the relative strength index (RSI), the stochastic oscillator is another popular technical indicator that comes highly recommended.
It is not a good idea to rely just on the readings provided by the stochastic indicator, even though it is still a very useful instrument.
This is mostly because the indicator has the propensity to provide misleading trade indications. It is possible that the asset's price movement will not correspond to the trading signal created by the indicator under certain circumstances in which the market volatility is significant.
As a result of this, it is recommended that the stochastic oscillator be used in conjunction with several other technical indicators, such as the relative strength index (RSI) and the moving average convergence divergence (MACD).


Free Resources
To continue learning and advancing your career, check out these additional helpful WSO resources:


or Want to Sign up with your social account?