Roy’s Safety-first Criterion
A decision criterion utilized in portfolio selection that is related to safety in financial investments.


What is Roy’s Safety-first Criterion?
Roy’s safety-first criterion is a decision criterion utilized in portfolio selection that is related to safety in financial investments. Investments always bring the risk for your money, with the level of risk depending on the type of investment.
Every investment requires risk analysis by the investor, or one can only be moments away from losing money. So we need to know what kind of investment is safer or suitable for our risk appetite.
Roy’s safety-first criterion is one of the first ratios to measure the amount of downside risk. As a result, it’s a risk management tool that can help investors decide what kind of portfolio suits them.
Also known as the SF Ratio, a safety-first ratio is an approach to investment decisions given a level of risk for a minimum rate of return. It allows investors to compare different investments based on the probability that they will fall below their desired level of required return.
Arthur Roy introduced it in 1952 in Econometrica. Below is an example of the safety-first rule:
- Roy’s Safety-First Criterion is a decision rule used in portfolio selection that prioritizes minimizing the risk of falling below a specified safety level or minimum acceptable return, rather than maximizing expected returns.
- The criterion aims to protect against significant losses by focusing on the probability of returns falling below a predetermined threshold, thereby addressing the downside risk of investments.
- The criterion involves calculating the probability distribution of portfolio returns and choosing the portfolio that minimizes the probability of returns falling below the safety level.
- This criterion is often applied in scenarios where investors have a high aversion to extreme negative outcomes and prefer a more conservative approach to managing their investment portfolios.
Formula for Roy’s Safety-first Criterion
The formula for Roy’s safety-first rule is:
SF Ratio = (E(r) - Threshold Return) / (Std. Deviation)
Where,
- E(r) = Expected returns from the portfolio
- Threshold Return = Investor’s minimum required rate of return
The best portfolios are those that minimize the chance of returns falling below the threshold level as well as maximize returns.
What Does Roy's Safety-First Criterion Tell You?
The SF Ratio tells us the probability of getting the minimum required rate of return. Therefore, the investor should choose an optimal portfolio with the highest SF Ratio.
Using this ratio, the investor can calculate his downside risk for different portfolio combinations of asset types and sizes. Investors regard this as a risk management philosophy and an evaluation method.
The SF Ratio signifies the extra return you are getting over the threshold level, based on how much volatility (which is symbolized by standard deviation) the portfolio faces, i.e., the amount of risk in it. The higher the value of the SF Ratio, the less risk for the investor.
The SF Ratio is also the foundation of asset pricing under loss aversion.
Assuming that returns are regularly distributed, the safety-first optimal portfolio can be chosen using one of the two criteria below:
- Lowest probability of RP < RL (where RP is actual return and RL is minimum acceptable return)
- Highest SF Ratio
Using Roy's criterion (assuming normality), there are three phases to selecting a portfolio:
- Calculate the SF Ratio of the portfolio.
- Calculate the SF Ratio and evaluate the standard normal Cumulative Distribution Function (CDF); the likelihood that the return will be smaller than RL is N.
- Select the portfolio with the lowest risk.
Roy’s Safety-first Criterion And Sharpe Ratio
The way we define the SF Ratio is very similar to the Sharpe ratio. The Sharpe ratio is one of the most famous ratios used to calculate risk-adjusted return. In addition, the Sharpe ratio can be used to evaluate a portfolio's past performance (ex-post), where actual returns are used in the formula.
William F Sharpe, a Nobel winner and retired professor of finance at Stanford University, was honored with the measure's name.
The Sharpe ratio is the same as the SF Ratio, only it uses the risk-free rate as the threshold rate of return. The Sharpe ratio also aims to evaluate the shortfall risk of an investment.
The Sharpe ratio compares the excess portfolio return to the risk-free rate and its standard deviation. Usually, the risk-free rate is represented by the 90-day Treasury bill rate.
For normally distributed returns, Roy's Safety-first criterion—with the risk-free rate as the least acceptable return—results in a portfolio identical to the one we would have chosen using the Sharpe ratio.
Visual Representation of Roy’s Safety-first Criterion
Roy's safety-first criterion is to keep the left tail as little as possible. The area represents the probability of the portfolio generating a return less than the threshold to the left of the threshold level return.
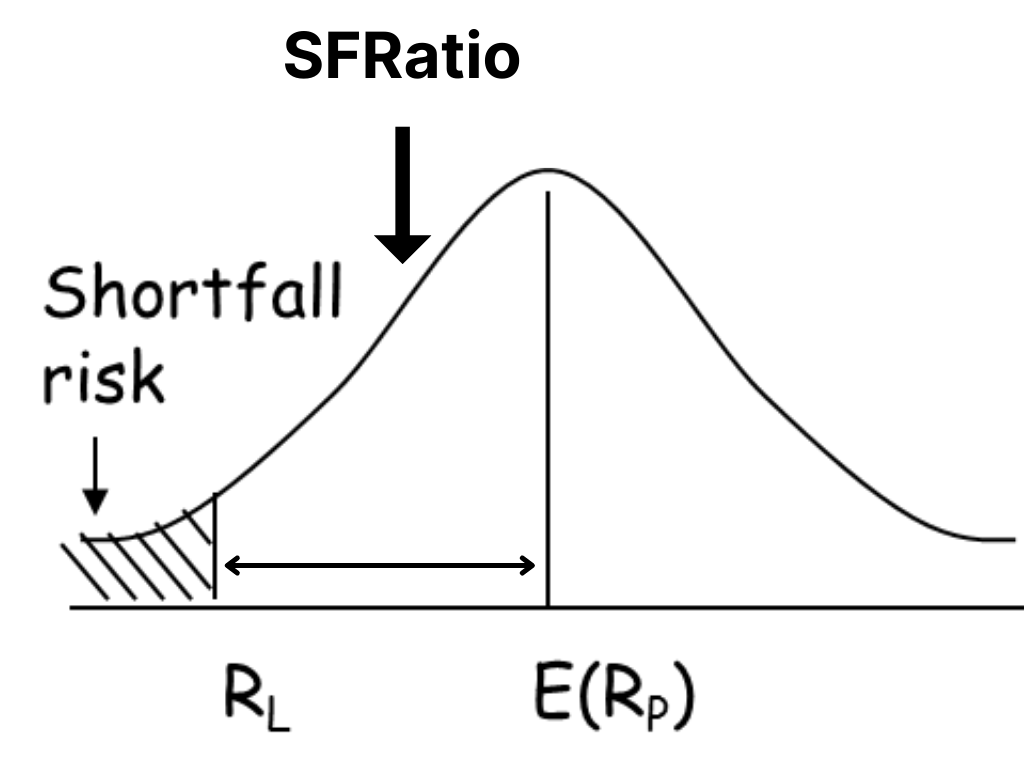
The ratio indicates the number of standard deviations below the mean. For example, a value of 1 represents one standard deviation below the mean.
As a result, the higher the criterion value, the smaller the left tail, and the less likely the portfolio will provide a return below the threshold.
The safety-first criterion and shortfall risk go hand in hand. The danger of delivering a return that is less than the threshold level is known as shortfall risk. In other words, shortfall risk is the area to the left of the threshold level return on a normal distribution graph. It's crucial to remember:
- The lesser the chance of a shortfall, the greater the ratio.
- The more significant the risk of a shortfall, the lower the ratio.
A z-table for negative values can be used to calculate the risk of a shortage. We'll perform a complete example below:
Let us consider a portfolio with an expected return of 6%, a standard deviation of 11%, and a 0% threshold limit. Then, Roy's safety-first ratio will be =
(6% - 0%)/ 11% = 6/11 = 0.54 = 0.5(approx)
The expected return is 6%, the threshold return is 0%, and the SF Ratio produces 0.5, which means it is 0.5 standard deviations below the predicted return, as shown above.
The area under the curve starting from the left of the threshold return is known as shortfall risk. For example, -0.5 equates to a z-score of 0.3085 or 30.85%.
Example of Roy’s Safety-first Criterion
Let's understand the SF Ratio with an example.
Let there be three portfolios. The standard deviation and expected return of each of them are also given. The investor wants a return of no less than 4%.
| Portfolios | Expected Return | Standard Deviation |
|---|---|---|
| Portfolio A | 12% | 14% |
| Portfolio B | 10% | 11% |
| Portfolio C | 8% | 6% |
For Portfolio-A, the SFRatio or Roy’s safety-first ratio will be =
(12% - 5%) / 14% = 7/14 = 0.5
For Portfolio-B, the SF Ratio will be =
(10% - 4%) / 11% = 6/11 = 0.54
For Portfolio-B, the SF Ratio will be =
(8% - 4%) / 6% = 4/6 = 0.66
So, based on the concept of the safety-first Criterion, the portfolio with the highest ratio provides the lowest probability of yielding returns less than the minimum threshold limit. Thus, the investor should invest in Portfolio-C, which has the highest SF Ratio and least shortfall risk.
To inform you of more such ratios and measures like this, we have a course that can teach you how to invest your money depending on the wealth you want to generate in a given amount of time.

Free Resources
To continue learning and advancing your career, check out these additional helpful WSO resources:


or Want to Sign up with your social account?