Volume Weighted Adjusted Price (VWAP)
It gives the day trader a better understanding of the average price at which the securities are traded throughout the day


What Is the Volume-Weighted Average Price (VWAP)?
The Volume Weighted Average Price (VWAP) considers both volume and price. As a result, it gives the day trader a better understanding of the average price at which the securities are traded throughout the day.
A significant trading benchmark is displayed daily, beginning at the opening price and finishing at the intraday closing price.
Technical traders commonly utilize it as a versatile instrument to discover good investing equities. It is also employed by managers of mutual funds when they must purchase a sizable quantity of a certain stock.
It is also frequently used as a benchmark by investors who want to be more passive in the market, typically pension funds and mutual funds, and traders who want to know whether a stock was acquired or sold at a reasonable price.
It is computed by dividing the total trade volume for the day by the full value of all trading sessions' dollar amounts. The computation starts when trading opens and ends when it closes.
Only the current trading day is covered by it; hence only intraday periods and data are considered in the calculation.
Analysts and traders frequently use this weighted average calculation to assess a stock's demand in terms of volume and price. Then, after considering the day's orders, it computes the mean value for calculating purposes.
Depending on the requirements, it may be dispersed throughout a single period or over a number of them.
Analysts and portfolio managers use it to filter out the noise brought on by daily price swings and establish a reasonable asking price for equities. Traders can see how the stock trades during the day.
The overall average price relative to the securities volume is known as the "volume-weighted average price," and it is determined using the formula mentioned below:
(Cumulative Price * Volume) ÷ (Cumulative Volume)
Investors can use this average price concerning the volume to determine when to enter and exit the market throughout the trading day by comparing the current price to a benchmark.
It determines the stock's average price based on the volume of shares exchanged at different prices in a single day.
The graph shows the indicator as a moving average, but it moves considerably more slowly than your 8 and 20-day moving averages.
- Volume-Weighted Average Price (VWAP) combines volume and price, aiding day traders, mutual fund managers, and passive investors in understanding the average price of securities traded throughout a day.
- VWAP is computed by dividing the total trade volume by the total dollar value, providing a benchmark for assessing whether a stock was transacted at a reasonable price.
- It is used to filter out daily price noise, determine asking prices, and identify entry/exit points, especially effective for intraday analysis.
- VWAP helps identify market sentiment; stocks below the line are considered "cheap," suggesting a short position, while stocks above the line are deemed "expensive."
Understanding the Volume Weighted Average Price Indicator
A person can use it to pinpoint the precise point in a time frame where the momentum lies and receive important information about a stock's price movement.
Managers of hedge funds and mutual funds utilize this pricing tool to manage portfolios and buy a bulk quantity of shares at that price without significantly impacting the market.
To maximize their profit while simultaneously keeping a portion of the average, they buy below the average and sell above it.
Let's use a hypothetical trader dealing with a stock that has repeatedly failed to break above the line due to persistent selling pressure.
Therefore, he might be interested in knowing the precise point at which the stock successfully crosses the indicator line. Otherwise, he might find himself on the wrong side of the market's momentum if he decides to take a short position.
This indicator is derived from traditional tick data. As one might anticipate, there are a lot of ticks (trades) every minute of the day. Therefore, operational security may experience 20–30 ticks in a minute during an active period.
A typical trading day on the stock market lasts 390 minutes, resulting in many stocks having over 5000 ticks daily. This is because more than 5000 equities are traded daily, and these ticks quickly mount up. As a result, tick data uses a lot of resources.
Interpreting the Weighted Average Price Indicator
This technical tool gives traders vital details about a stock's price movement, such as pinpointing the precise location of the momentum within a given time frame.
Stocks trading below the line are seen as "cheap" or "of value," and they advise traders to go short. However, stock prices over the weighted average price line are considered "expensive."
The ratio is then shown as a line on a graph. Similar to a moving average, the market is said to be in an uptrend when the price is above the indicator line and a downtrend when the price is below the indicator line.
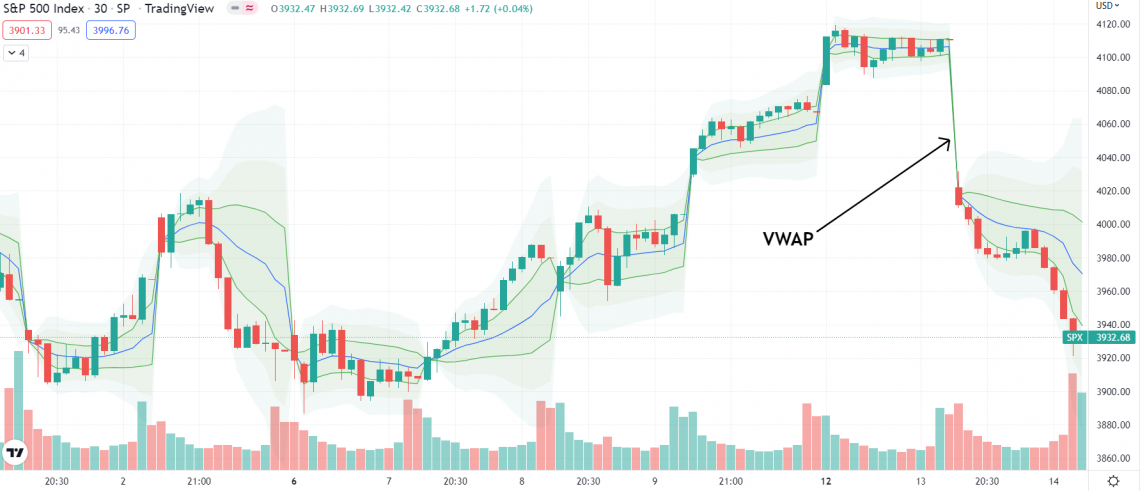
How can you tell if a price moves above or below the VWAP line? Candlesticks and trend lines can be combined and programmed into a technical system.
The trend line is treated like a support and resistance line in a weighted average price chart, and the candlesticks show the price change.
A Simple Moving Average (SMA) differs greatly from the volume-weighted price indicator. Despite how similar they may appear, each performs a different calculation.
The volume-weighted average price provides a very limited viewpoint on whether a short or long position is preferred in trading.
It is an insufficient metric because it simply summarizes how security performed during the day.
It demonstrates no meaningful effect in generating predictions or calculations for the future because it is a summary version of just one day. Even though it can be computed over a certain amount of time, its precision might only sometimes be dependable.
The ratio is then shown as a line on a graph. Similar to a moving average, the market is said to be in an uptrend when the price is above the indicator line and a downtrend when the price is below the indicator line.
It acts as a benchmark for prices for a single day. It is, therefore, ideal for intraday analysis. Chartists can determine the intraday trend by comparing the current prices with the VWAP values.
Relative value can also be ascertained using this. Prices below VWAP values are considered low for that particular day or hour. Prices exceeding these levels, however, are comparatively high for that day or that specific hour.
How to Calculate Volume Weighted Average Price
The volume-weighted average price is calculated each day. The markets open and close at the beginning and end of the day, respectively.
Because it is performed every day, the calculation requires intraday data. The formula used:
-
Add the high, low, and closing prices together, then multiply the result by three to get the usual typical price (TP) for each period [(H+L+C)/3].
-
Depending on the trader's preference, each candle symbolizes a time range of 5 or 30 minutes.)
-
Multiply the volume by the Typical Price (TP).
-
VWAP is the typical price x volume divided by the total volume.
It generates a volume-weighted average price for each data point when it is calculated over time. A moving volume weighted average price is affected by aggregating the multiple end-of-day indicator data and averaging them over several periods.
This indicator is based on previous data and does not automatically have any forecasting capabilities. In addition, this indicator is fixed to the day's opening price band. As a result, the indicator's lag lengthens during the day.
In algorithmic trading, weighted average price ratios are used to assist traders and investors in choosing the optimal price at which to purchase or sell, consistent with the market's volume.
When trading many shares, the volume-weighted average price is quite beneficial. By using this indicator, traders can avoid artificially boosting the trading volume for the asset they wish to purchase.
How to trade using the VWAP indicator?
The weighted average price can aid traders in comprehending any new trend. The direction of the trend—rising or falling—will reveal the market sentiment. A smooth line can recognize an emerging trend despite the turbulent prices.
The term "weighted average breakout" refers to the point at which a stock price surpasses the indicator and surpasses its average price. Due to the market's strong bullish dynamics, traders open a long position.
This indicator offers an understanding of both price and volume, and as a result, it has various trading-related applications:
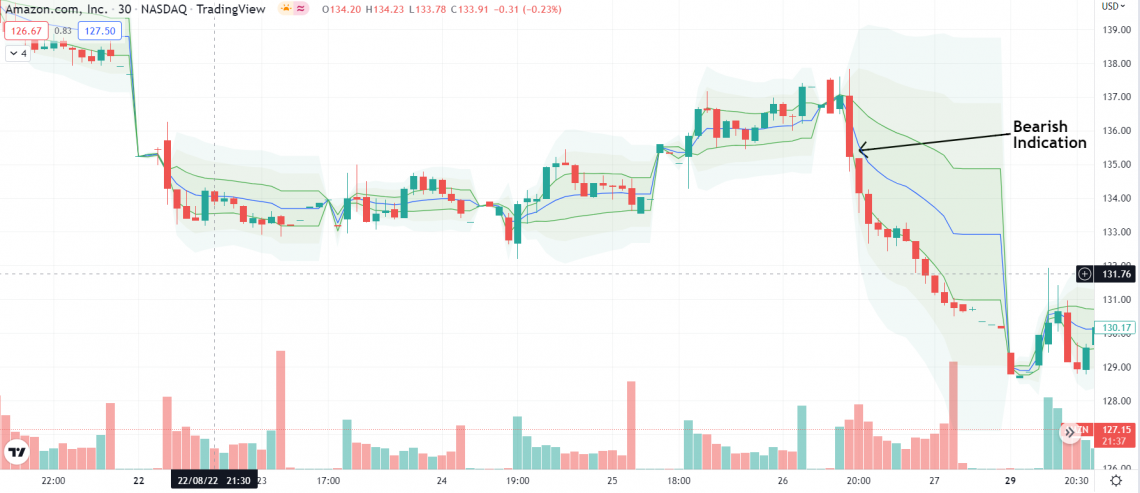
A) It helps in identifying a bullish or a bearish market.
The market is bullish when the price is above the VWAP and bearish when the price is below. In a bullish market, the buying price will increase, and the trend line on the chart will climb.
However, there is more pressure to sell the stock during a bear market, which causes a negative trend on the stock chart.
B) It indicates when to enter or exit a trade.
When there is a buy signal, investors who use the indicator as a technical research tool won't purchase a stock. They instead wait for a fantastic opportunity.
If they pay less than the indicator line, a trader will only buy a stock for its typical price.
On the other hand, traders that use the line as an indicator will be able to purchase at a discount and increase their profit when they sell the stock. When buying stocks allows the investor to make more educated decisions.

C) It outperforms the moving average indicator
Pension funds seeking to increase their market share also use the weighted average price indicator. It allows them to adopt a different viewpoint without seriously upsetting the market.
Price but not the volume, is included in a simple moving average. Instead, the SMA is determined by adding up all the closing prices for a specific time frame (let's say 10 days) and then dividing that sum by the total number of periods (10).
In day trading, timing is crucial, and the VWAP advises investors on when to buy and sell rather than merely going with the flow.
The indicator line is also used to determine a market's support or resistance level. For instance, if the stock price began below the VWAP line and repeatedly tried to cross it, that location may be considered a resistance zone.
The VWAP line can also support when a stock price begins above it and pauses close to it before rising again.
Institutional investors use this indicator to buy shares in bulk without causing any market disruption. Let us look at how this happens with the help of an example:
A fund house wishes to purchase 50,000 shares of a specific business. Now, if it places an order for the entire block at once, the market will surge as the exchange tries to fill it.
It will boost the market and increase demand for that stock, encouraging other traders to purchase it at a price above the mutual fund's opening bid price and then sell it for an even greater price.
By dividing the overall demand into smaller amounts and investing using an automated trading technique, the mutual fund can prevent the problem and keep the price near the indicator line.
The Bottom Line
Following the slope of the line is the basic guideline when using the weighted average price indicator for trading. However, just like with any other trading instrument, purely basing your trading strategy on this indicator may be at odds with current market sentiment.
Weighted average predictions must agree with other trading tools to prove a trend reversal.
A single stock's price may increase if you attempt to purchase a sizable quantity of it on the market.
A few disadvantages are associated with using the VWAP ratio. First, it is a cumulative indicator, which depends on many data points that will continue to increase throughout the day. This causes the majority of problems.
It can also be used to gauge the effectiveness of trading. For example, institutions or individuals can assess the price of a security after buying or selling it by comparing it to VWAP values.
On the other hand, a sell order carried out over the VWAP would be regarded as a good fill because it was sold for more than average.
Remember that VWAP is a cumulative indicator, meaning more data points are added to the total over the day.


or Want to Sign up with your social account?