Crossover Rate
Identifying the Optimal Cost of Capital Where Net Present Values Converge for Two Investments in Perfect Equilibrium


What Is The Crossover Rate?
The crossover rate is the cost of capital at which the net present values of two investments are equal. Graphically, it is the intersection of two NPV profiles for two projects. An NPV profile is the net present value of a project plotted against different discount rates.
This idea is frequently encountered in finance, especially capital budgeting, which studies using different methods and processes to analyze various investments and projects.
Capital budgeting aims to identify investments whose cash flows are more significant than their costs.
Every business and corporation has multiple projects and investments on its radar. As an objective to grow as a company, they are constantly trying to pinpoint the tasks that would introduce the most cash inflows into the company.
There are multiple ways to evaluate the profitability of an investment which would help investors and executives make the right decisions to undertake them. It is related to the net present value method and the internal rate of return.
Assuming a financial manager has estimated the future cash flows an investment can bring, the decision maker can determine whether launching that project creates value in a company. That is done by calculating the net present value of that investment.
For such single investments, deciding whether to undertake that investment is relatively straightforward.
However, when faced with multiple potential projects, most companies are restricted to choosing only one. Such investments are called mutually exclusive investments.
If managers were to use the IRR method in evaluating mutually exclusive investments, they would be misled in making their decision as the IRR is incompatible with mutually exclusive projects. The net present value method would significantly help in this case.
- The crossover rate is the cost of capital at which the net present values (NPVs) of two investments are equal.
- Net Present Value (NPV) and Internal Rate of Return (IRR) are fundamental concepts in capital budgeting used to assess the profitability of investments.
- NPV can vary depending on the required rate of return, leading to potential misjudgments when comparing projects based solely on IRR.
- NPV is calculated by comparing the present value of future cash flows with the initial investment, incorporating the discount rate.
- The crossover rate is the discount rate at which NPVs of two projects are equal, resolving the dilemma of mutually exclusive projects.
Overview of NPV and IRR
The net present value and the internal rate of return of a project rate are two essential concepts in capital budgeting in finance. Both are methods for determining the profitability of an investment. In addition, both can be used to decide to launch a project.
The net present value of an investment is the difference between the present value of the cash flows of the investment and the initial cost of the investment. If the present value of the future cash flows exceeds the project's cost, it is said to be profitable.
The net present value of a project is a number that quantifies the value created in a company in dollar terms:
-
An investment with a positive NPV indicates that it has created value, so it is advisable to undertake that investment,
-
An investment with a negative NPV indicates that it has reduced value, so it is advisable not to undertake that investment,
-
An investment with an NPV equal to 0 indicates that it has neither created nor reduced the value of a business, so managers are indifferent to undertaking that investment.
The net present value rule states, "When the net present value of an investment is positive, it should be accepted; if it is negative, it should be rejected." NPV is one of the most famous and reliable methods of evaluating the return on investment.
The IRR method of evaluating an investment or a project is very similar to the NPV method. That is because instead of having a specific discount rate for which we calculate the NPV, we now have to find the discount rate, which makes the NPV equal to 0.
Since this metric represents the annualized return of an investment, the higher the rate of return of a project, the more attractive it will be for managers to launch the project. This method is used for many investments in different fields, including private equity and venture capital.
Every business faces a challenge when selecting between competing projects. Companies use two famous metrics to choose the best investment: net present value and internal rate of return.
Although both methods are prevalent, they may give opposing results when evaluating the same investments. For example, the NPV rule can accept a project, while the IRR rule doesn’t. One case is when there are mutually exclusive projects, where the crossover rate comes in handy.
Calculating NPV and IRR
It is essential to cover the fundamentals of the net present value and the internal rate of return and their calculations because the idea of the crossover rate stems from those two preceding concepts.
Calculating the net present value of investment requires comparing the present value of the cash flows the project brings in with the initial cost of launching that project. Therefore, the first step in calculating it is knowing how to calculate the present value.
The formula for calculating the present value of the future cash flows is:
![]()
-
CF(t) is the net cash flow (cash inflow - cash outflow) that the investment gives at year t.
-
r is the discount rate.
Although this formula seems complicated, it is just calculating the present value of each cash flow and adding them to find the present value of all the cash flows. Therefore, the formula for calculating the net present value is
![]()
We can try to deduce the formula for calculating the internal rate of return from the formula of the NPV of an investment. By definition, the IRR is the discount rate at which the NPV of a project is equal to zero. Hence the formula is:
![]()
It is essentially the formula for calculating the net present value of an investment. However, the difference is in the variable we have to solve the equation. In the NPV formula, the unknown variable to be solved was NPV.
In the IRR formula, on the other hand, the variable to be solved for is r, which is the discount rate of the investment. NPV is already taken to be zero, so the only unknown variable left is the discount rate, which is the internal rate of return when NPV is equal to zero.
Understanding Crossover Rate
One of the disadvantages of the IRR method, which can lead to erroneous results, is using it when there are mutually exclusive investments. That is to say; when there is more than one investment, the company must only choose one of those projects to launch.
Intuitively, one can suggest taking on the project with the highest internal rate of return. After all, this metric shows the annualized return of the project. While this idea seems plausible at first, in reality, we can’t use this method to compare two investments.
The net present value of the project with the lower rate of return can be higher than that with the higher return.
Calculating NPV depends on the required rate of return. For different required rates of return, one project can seem more profitable than the other.
The crossover rate is the specific rate of return for which the net present values of the two investments are equal. This means that both projects are equally profitable, and management should be indifferent between choosing either of the two projects.
Let us take an example that highlights the misleadingness between NPV and the IRR and how we can find the crossover rate of two projects. Suppose there are two mutually exclusive projects.
For instance, opening a lemonade stand or opening a hot dog stand.
For now, let’s call them project A and project B. The cash flows for both projects over four years are as follows:
| Year | Project A ($) | Project B ($) |
|---|---|---|
| 0 | -100 | -100 |
| 1 | 50 | 20 |
| 2 | 40 | 40 |
| 3 | 40 | 50 |
| 4 | 30 | 60 |
The IRR for project A is 24%, and the IRR for project B is 21%. We calculated it using the formula for IRR.
One might be tempted to launch project A because of the higher IRR, hence a higher return, but this is a fallacy. To see why this way of thinking is flawed, let us compare the net present values of the two projects using different discounting rates.
| Discount Rate (%) | NPVA ($) | NPVB ($) |
|---|---|---|
| 0 | 60.00 | 70.00 |
| 5 | 43.13 | 47.88 |
| 10 | 29.06 | 29.79 |
| 15 | 17.18 | 14.82 |
| 20 | 7.06 | 2.31 |
| 25 | -1.63 | -8.22 |
Upon comparing the NPVs of the two investments, we realize that which project is more profitable (has a higher NPV) depends on the discount rate used. At a discount rate of 5%, for instance, we should choose to launch project B, although the IRR rule states otherwise.
Note that for lower discount rates, NPVB is greater than NPVA (which means project B is more profitable), and for higher discount rates, NPVA is greater than NPVB. It means that at some specific discount rate, the net present values of both projects must be equal, that discount rate is called the crossover rate.
It should be clear that in this case, it must be between 10% and 15% since it’s between this interval that the profitability of the projects switches from project B to project A.
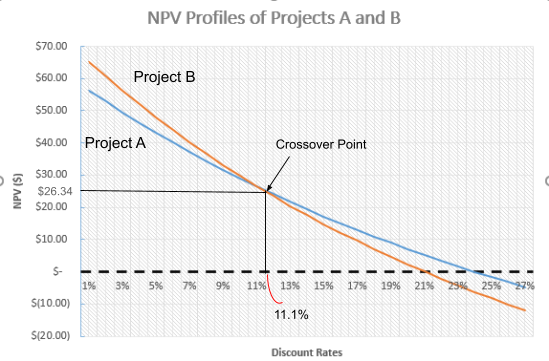
Below we can see the NPV profiles of both projects A and B. We can see that the NPVs of both projects are equal when the discount rate is roughly 11.1%. This discount rate is called the crossover rate. We will see how to calculate it in the next section.
Crossover Rate Formula
It is the discount rate for which the net present values of two investments are equal. Therefore, we can use the net present formula to come up with an equation that would solve for it.
Let us go back to our initial example:
-
Project A costs $100 and has cash inflows of $50, $40, $40, and $30 at the end of years 1, 2, 3, and 4, respectively.
-
Project B costs $100 and has cash inflows of $20, $40, $50, and $60 at the end of years 1, 2, 3, and 4, respectively.
As the two projects are mutually exclusive, one way to find the crossover rate is to equalize both net present values and solve for r. To do this, we will use the NPV formula and solve the net present value of project A equal to the net present value of project B.
![]()


Solving for r will result in us finding the crossover rate, which is 11.1%. Unfortunately, there is no arithmetic way of solving such an equation, so the best way to solve it by hand is by using trial and error. Another method of calculation is using the IRR formula.
The second method requires us to calculate the difference between the initial cost of the projects and the difference in the cash inflows in each period.
These results would resemble the cash inflows of a single project. The IRR of that project is the crossover rate.
| Year | NPVA-B |
|---|---|
| 0 | 0 |
| 1 | 30 |
| 2 | 0 |
| 3 | -10 |
| 4 | -30 |
To find the IRR of this project, we use the formula:


We also have to solve for r in this equation. If we want to do it manually, there is no other choice than to solve it by trial and error. Otherwise, a financial calculator will be of great assistance. This method is more straightforward than the first, although both will give us a crossover rate of 11.1%.


or Want to Sign up with your social account?