Free Cash Flow Yield
Metric that evaluates a company's ability to generate free cash flow in relation to its market value


What Is Free Cash Flow Yield?
The free cash flow yield is an important financial metric that evaluates a company's ability to generate free cash flow in relation to its market value.
It is calculated by dividing the free cash flow per share by the current share price. It bears similarity to the earnings yield but focuses on the company's ability to generate cash rather than GAAP earnings.
For businesses, regardless of their size, free cash flow yield serves as a valuable indicator of cash flow efficiency relative to the company's scale. Cash flow, a key metric for investors, provides insights into the company's operational performance.
Essentially, the free cash flow yield serves as a reliable metric for measurement, indicating whether a company is financially resilient or vulnerable.
This is particularly significant in scenarios where quick access to cash is essential, such as addressing debt, meeting other financial obligations, or in the event of liquidation.
- Free Cash Flow Yield is a crucial financial metric assessing a company's ability to generate free cash flow relative to its market value, calculated as Free Cash Flow per Share divided by the current Share Price.
- The metric indicates a company's cash flow efficiency concerning its size, offering valuable insights into operational performance for investors.
- Free Cash Flow Yield is a reliable measure of a company's financial resilience or vulnerability, especially in scenarios requiring quick access to cash, such as debt management, meeting financial obligations, or liquidation.
- It also emphasizes the company's ability to generate cash rather than GAAP earnings. Investment professionals consider it one of the best metrics to judge company performance.
Understanding Free Cash Flow Yield
The FCF yield is a relative valuation metric similar to earnings yield; it treats the market cap as the denominator and the cash flow as the numerator to calculate the yield.
A higher FCF yield is considered better; the business is generating a more increased per-share cash flow than its peer group.
According to many investment professionals, free cash flow is one of the best metrics to judge company performance, making the FCF yield one of the most used and reliable valuation metrics.
FCF is relied upon so much because it is very difficult to manipulate and is a good metric to judge the quality of a business. It is the excess cash that remains after operating and capital expenditures.
If a business generates excess cash over and above its Capex and Opex requirements, it can indicate strong financial health. The extra cash can then be used for other investments, buybacks, and debt obligations.
Free cash flow is also very flexible and can be adjusted for different industries.
For example, technology companies do not have a lot of capital expenditures. Still, they have a lot of intangible assets that they regularly invest in and grow, so we can consider them as Capex to get a better idea of the business's capital spending.
Pharmaceuticals spend a lot on research and development (R&D) expenses, which can be capitalized and added to the total Capex of the firm to get a better idea of the true cash flow.
The FCF yield can be used on its own to compare businesses, but, like every other relative valuation metric, it will provide a clearer picture of value when used in combination with similar ratios.
Formula for Free Cash Flow Yield
The FCF yield is one of the best valuation metrics out there as free cash flow is a great quantitative metric but, simultaneously, shows the quality of the business as higher cash flow generation is associated with better overall business quality.
Formula:
Free Cash Flow Yield = Free Cash Flow/ Market Cap
or
Free Cash Flow Yield = Free Cash Flow per Share/ Market Price per Share
Calculating the Free Cash Flow Yield
There are two components to calculating FCF: the cash flow from operations and the Capex. Divide that by the market cap, and we arrive at an FCF yield for the business.
Here, we'll see the FCF yield of two comparable companies and then value them relatively to see which one is cheaper.
Example 1: Mastercard vs. Visa
Mastercard and Visa are a few of the world's largest financial services companies, mainly focusing on payment systems.
Both are mature firms with very little incremental investment needs for customer acquisition and network expansion, thanks to their well-built network effects.
These two companies generate a lot of FCF and thus can be used as case studies to compare their FCF yields.
Visa (V): Visa Annual Report
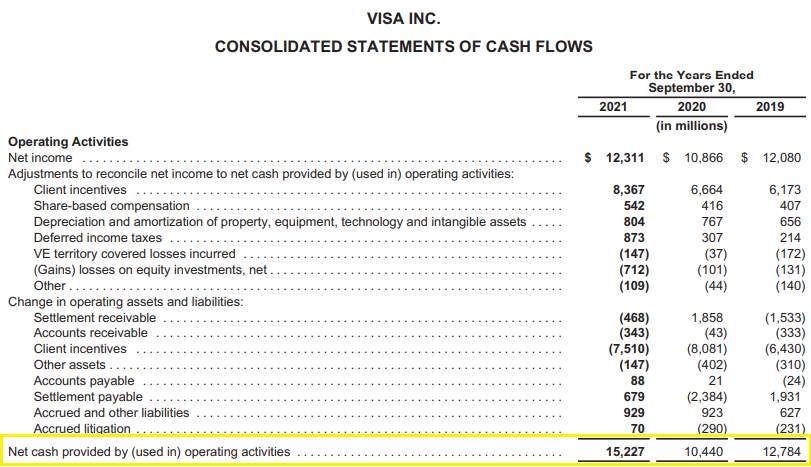
The CFO for Visa for the year 2021 is $15,227 million or $15 billion.
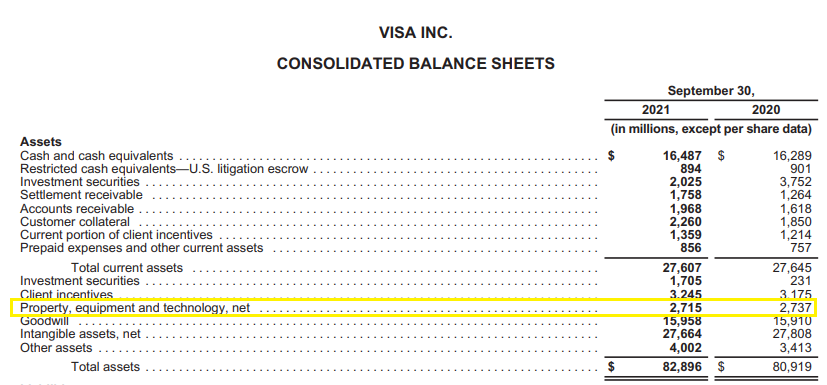
Visa has done Capex of:
CAPEX = Net property, plant, and equipment
CAPEX = 2,715 - 2,737 = - 22
CFO = 15,227
FCF = CFO - CAPEX
FCF = 15,227 - (- 22)
FCF = 15,249
Visa has a free cash flow of $15 billion for 2021
The market cap for Visa stands at $454 billion
FCF Yield = FCF / Market Cap
FCF Yield = 15,249 / 454
FCF Yield = 3.35%
Mastercard Inc. (MA): Mastercard Annual Report
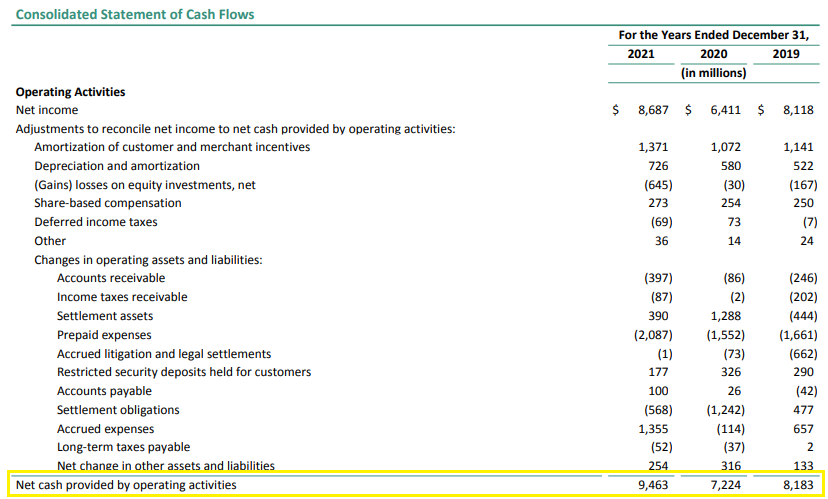
CFO = 9,463
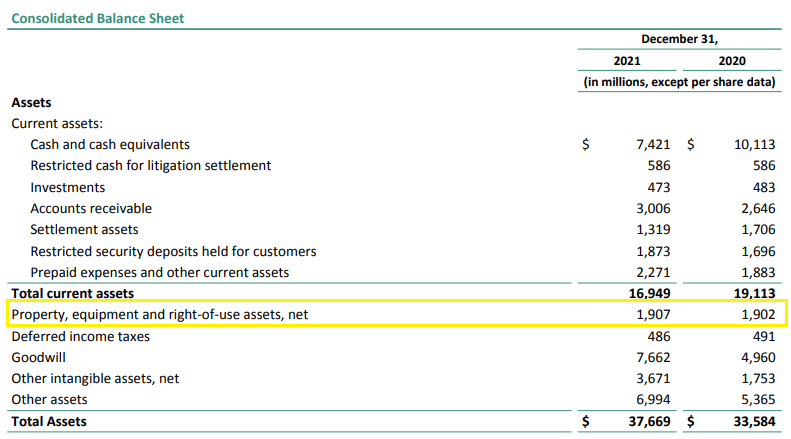
CAPEX = Net property, plant, and equipment
CAPEX = 1,907 - 1,902 = 5
FCF = CFO - CAPEX
FCF = 9,463 - 5 = 9,458
Mastercard has a free cash flow of $9.4 billion
And a market cap of $356 billion
FCF Yield = FCF / Market Cap
FCF Yield = 9,463 / 356
FCF Yield = 2.66%
Visa Inc. has an FCF yield of 3.35%, while Mastercard has a yield of 2.66%; this means Visa is generating a higher proportion of free cash flow relative to its market price compared to Mastercard.
This states that every $100 invested in Visa will yield $3.3 of free cash flow, while every $100 Mastercard will yield an FCF of $2.66.
Visa has a P/E of 33, while Mastercard has a P/E of 37. Even with a higher free cash flow yield, Visa is cheaper than Mastercard.
The 10Y Treasury bond yield as of 9th June is 3.04%. Currently, Visa is yielding cash flows at a higher rate than the current market risk-free rate.
Example 2: Westlake Corporation Vs. Celanese Corporation
Westlake and Celanese Corp are specialty chemical manufacturers in Texas, United States.
Westlake Corporation (WLK): Annual Report
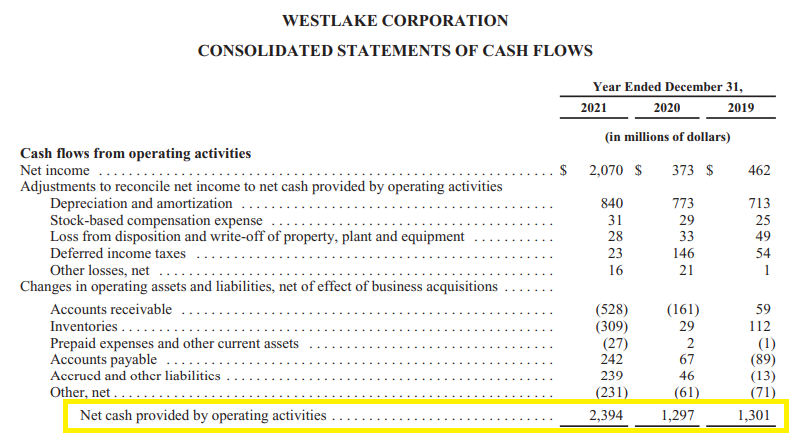
As shown in the above images, the CFO of Westlake for 2021 is:
CFO = $2,394
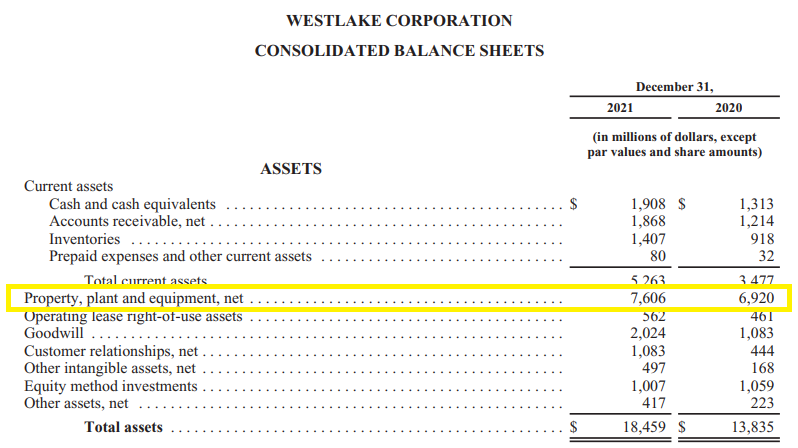
CAPEX = Net Property, Plant, and Equipment
CAPEX = 7,606 - 6,920 = $686
FCF = CFO - CAPEX
FCF = 2394 - 686 = 1,708
Westlake has a free cash flow of $1.7 billion for the financial year 2021
And a market cap of $16.7 billion
FCF Yield = FCF / Market Cap
FCF Yield = 1,708 / 16.7
FCF Yield = 10.18%
Celanese Corporation (CE): Annual Report
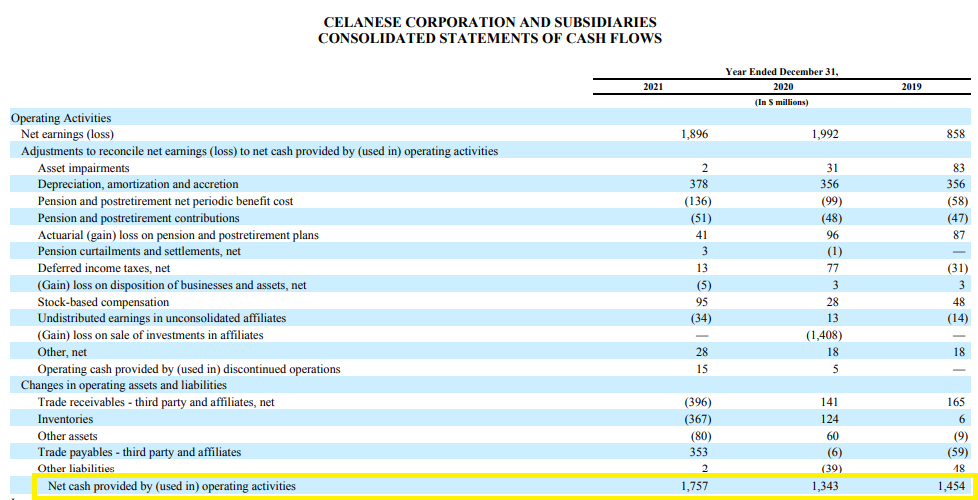
Celanese Corporation has a CFO of:
CFO = $1,757
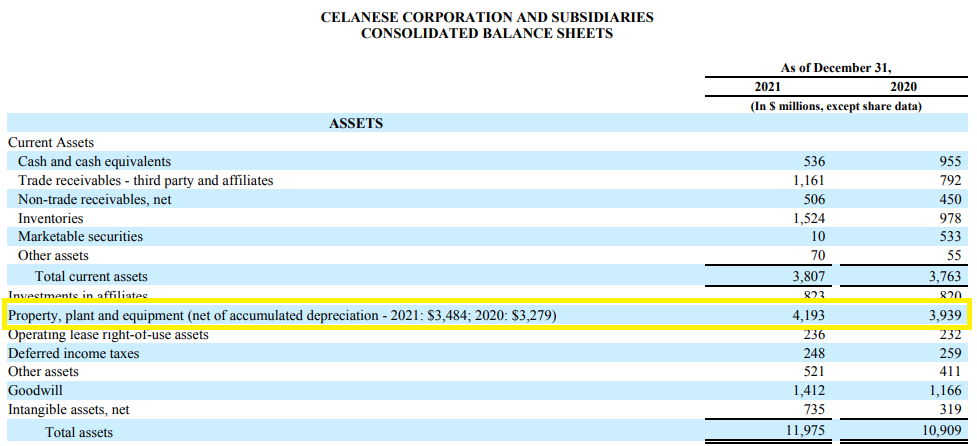
CAPEX = Net Property, Plant, and Equipment
CAPEX = 4,193 - 3,939 = $254
FCF = CFO - CAPEX
FCF = 1,757 - 254 = $1,503
Celanese Corporation has a free cash flow of $1.5 billion for the financial year 2021
And a market cap of $16.8 billion
FCF Yield = FCF / Market Cap
FCF Yield = 1,503 / 16.8
FCF Yield = 8.95%
Westlake has a free cash flow yield of 10.18%, while Celanese has an FCF yield of 8.95%. This shows that WLK produces higher cash flows and may be considered relatively cheaper than CE, but other factors should be considered for a comprehensive valuation.
Westlake has a P/E of 6, while Celanese has a P/E of 8 despite having a lower FCF Yield. So, Westlake has an overall cheaper valuation while generating higher FCF.
At the same time, these firms are showing yields that are much higher than the current US 10Y T-Bond rate of 3.04%.
- WLK has a spread of 7.16%
- While CE has a spread of 5.96%
Free Cash Flow Yield vs. Earnings Yield
To understand the difference between the two, we'll take a look at the table below:
| Aspect | Free Cash Flow Yield | Earnings Yield |
|---|---|---|
| Definition | Measures the cash generated by a company's operations | Measures the earnings generated relative to market value |
| Calculation | Free Cash Flow / Market Capitalization | Earnings / Market Capitalization |
| Focus | Emphasizes cash available for distribution to investors | Emphasizes profitability as reported on the income statement |
| Considerations | Reflects the company's ability to generate cash after meeting operational needs and capital expenditures | Affected by accounting choices and non-cash items |
| Relationship to value | A higher free cash flow yield is generally considered positive, indicating potential for dividends or reinvestment in the business | A higher earnings yield suggests a more profitable investment, assuming the earnings are of high quality |
| Limitations | Can be impacted by short-term fluctuations in working capital and capital expenditures | Susceptible to accounting adjustments and non-cash items that can distort true profitability |
Researched and authored by Aditya Salunke | LinkedIn
Free Resources
To continue learning and advancing your career, check out these additional helpful WSO resources:


or Want to Sign up with your social account?