Candlestick Patterns
A type of financial chart that shows the price movement of financial instruments by presenting them as patterns


What Is a Candlestick Pattern?
In the world of financial markets, trading, and investing, candlesticks patterns have become an essential feature that helps price action traders predict the direction of price, areas, and zones where the price is likely to stop, pull back, reverse, trend, and range.
Although some critics argue about the efficacy of price action, others believe that price action works and incorporate it into their trading strategies. A lot of trading algorithms also base their predictions on candlestick patterns.
As the financial markets are bullish, bearish, and neutral, candlesticks come in the same form. Bullish candlesticks signify that buyers are in control. Thus the price is going to the upside. The price opens lower and closes higher.
A bearish candlestick is the direct opposite of a bullish candlestick as it opens higher and closes lower. On the other hand, a neutral candlestick opens and closes at the same point, giving it a neutral black color.
A key point to note is that candlesticks can be configured to any color, as per the user's liking.
-
Candlestick patterns are crucial for predicting price movements and identifying key areas of interest in financial markets, often relied upon by traders and algorithms alike.
-
Various candlestick patterns, such as morning star, evening star, and doji, offer insights into market sentiment and potential price shifts, aiding traders in decision-making.
-
Candlestick charts provide a comprehensive view of price action, with their color aiding quick interpretation, and they suit different time frames, allowing for flexible analysis.
What are candlesticks?
Candlesticks are price charts that display four key levels in price per specified unit of time. These charts show the open, high, low, and closing in any chosen time interval. Candlesticks have a “body,” making the thick middle section and “wicks” on the outer ends of the body.
Candlesticks date back to the 18th century, developed by one of the ancient Japanese technical analysts, Munehisa Homma. Homma was a famous rice trader who used candlesticks to trade rice and predict future rice prices.
In 1991, a man named Steve Nison introduced the use of candlesticks in financial markets, first published in his book, “Japanese Candlestick Charting Techniques.” Now, candlesticks have been digitized and are used across the world.
Candles have two distinct features, namely, the body and the wicks. The body shows the opening and closing prices while the wicks show the high and low of the time interval in question. The body and size of wicks can be of any size, depending on market volatility.
Types of candlestick patterns
Candlesticks form different shapes, each telling different stories to traders and investors in the financial markets. Below is a discussion of the different types of candlesticks that form in the market and the indications they can provide.
These shapes present different signals and are used by price action traders in several ways. Algorithmic traders also use these patterns in developing their systems to reduce the use of the human mind and replace it with computer technology.
Candlestick patterns show momentum, reversals, volatility, continuations, and overbold and oversold regions. These patterns suit traders in all kinds of market cycles, i.e., trending, ranging, and choppy.
In general, the market has about 35 candlestick pattern formations which can be grouped into bearish patterns, bullish patterns, and continuation patterns. The understanding of these different types of formations gives an advantage in the financial markets.
Morning star
The morning star is one of the most commonly used indicators in price action trading. Traders use it as an indication of a reversal in a downtrend.
Hence, it is used as a signal that traders should either take profits from their bearish orders or hedge their positions against a possible bullish reversal.
This candlestick pattern forms at the end of a downtrend, and the star stands between one bearish candle and one bullish candle. The fact that this candle has wicks on both sides and a small body indicates indecision and, hence, a possible reversal.
The morning star pattern can be traded along with other indications to form a strong prediction and avoid fake-outs. For example, one of the indicators that can be used along with the morning star is Bollinger bands.
Bollinger bands are a range-bound indicator that signals the potential turning point in a given range-bound market. These bands have dynamic support and resistance and signals to sell on the resistance and buy on support.
When the morning star forms on the band's support line, it might be an excellent indication to close sell orders, hedge the position, or open buy orders. Again, using multiple indicators helps traders be sure of the setup, increasing the odds of winning.
Evening star
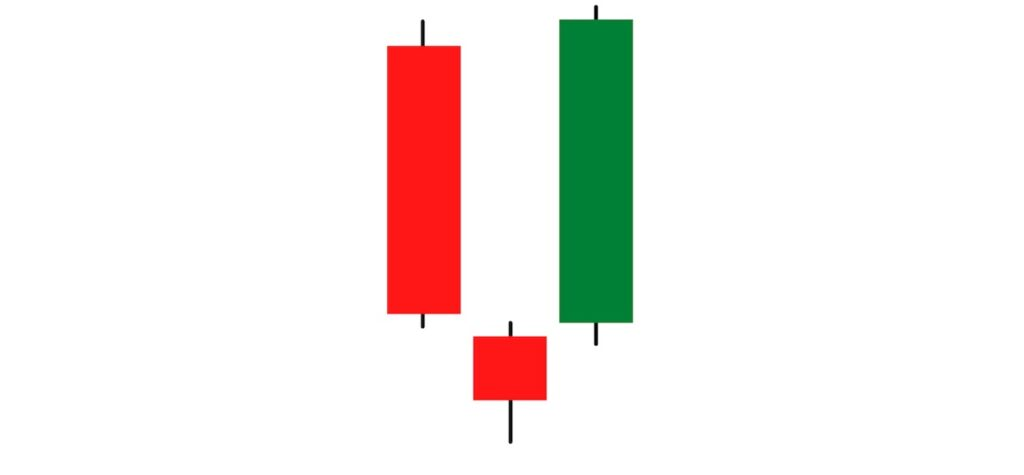
The evening star pattern is the opposite of the morning star pattern. This is formed at the end of an uptrend, and it typically indicates a bearish reversal and stands as one of the most commonly used indicators in price action trading.
Hence, it is used as a signal that traders should either take profits from their bullish orders or hedge their positions against a possible bearish reversal.
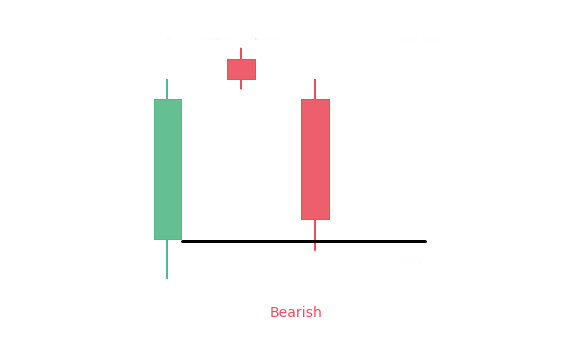
This candlestick pattern forms at the end of an uptrend and stands between a bearish candle and a bullish candle. The fact that this candle has wicks on both sides and a small body indicates indecision and, hence, a possible reversal.
The evening star pattern can be traded along with other indicators for higher accuracy, thus helping avoid fake-outs. For example, one of the indicators that can be used along with the evening star is Bollinger bands.
Bollinger bands are a range-bound indicator that signals the potential turning point in a given range-bound market. These bands have the nature of dynamic support and resistance that signals to sell on the resistance and buy on support.
When the evening star forms on the band's resistance line, it might be an excellent indication to close buy orders, hedge the position, or open sell orders. Again, using multiple indicators helps traders be sure of the setup, increasing the odds of winning.
Bearish and Bullish Marubozo
The bearish marubozo is a bearish candlestick, as the name suggests, that does not trade beyond the areas of its opening and closing, i.e., it does not have wicks.
This candlestick pattern signifies that the price is moving strongly in one direction, showing strong momentum.
In a trending market, a marubozo confirms the strength of the trend showing that only sellers are active, signifying potential areas for entry.
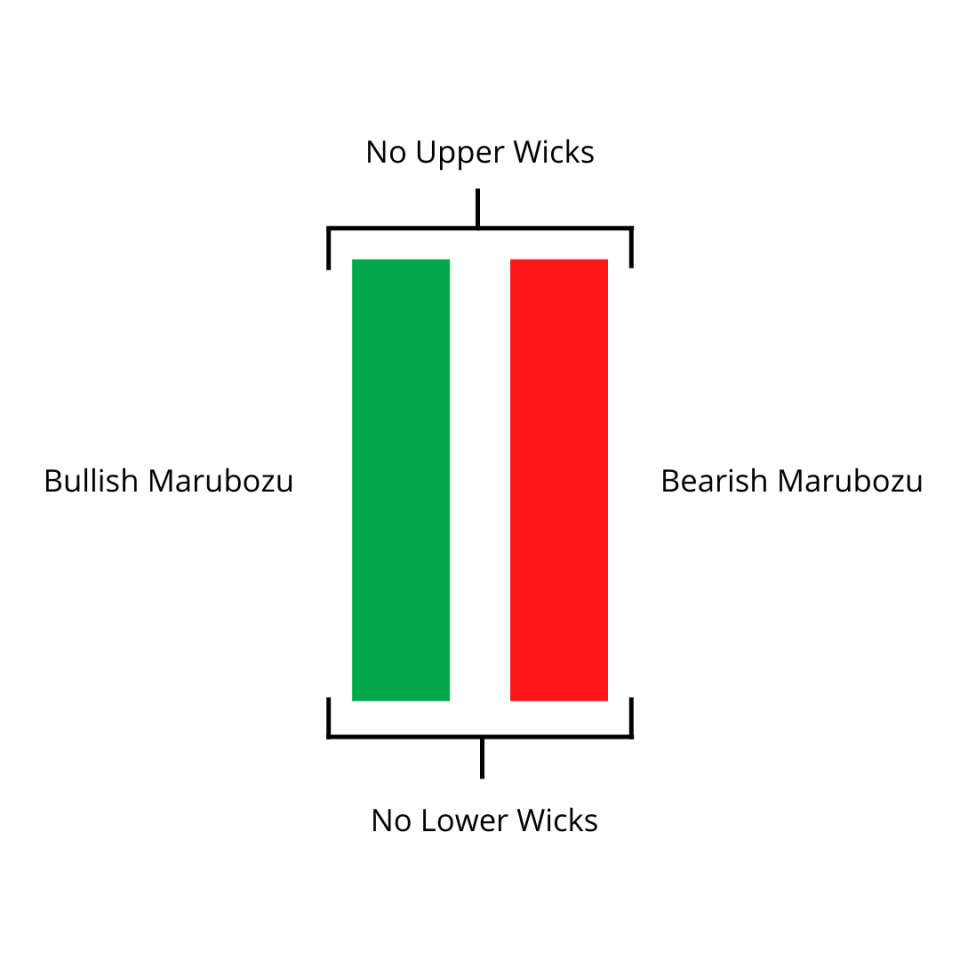
The bullish marubozo is a bullish candlestick that does not trade beyond the areas of its opening and closing, i.e., it does not have wicks.
This candlestick pattern signifies that the price is moving strongly in one direction, demonstrating momentum.
In a trending market, a bullish marubozo confirms the strength of the trend showing that only buyers are active, hence, signifying potential areas for entry.
Traders look out for momentum candles as a way to predict a strong momentum trend. Developers also use these candlestick patterns by integrating them into their trading systems.
Doji
A Doji is formed when the opening and closing price of the instrument is virtually the same while having tested some highs and lows beyond the opening and closing price.
Ordinarily, this candle has a black color, indicating neither a bullish nor bearish nature.
The Doji is primarily an indecision indicator that shows that bulls and bears are balanced, and no one knows where the price is likely to go.
For this reason, various interpretations are given to the Doji. It is a sign to traders to stop and reevaluate the market for a possible direction.
In other circumstances, it shows that primary trend followers are gaining momentum for a continuation while, sometimes, it shows that they are losing power, hence, predicting a reversal.
These interpretations may also differ depending on the different types of Doji, i.e the long-legged Doji, the common Doji, the dragonfly Doji, the gravestone Doji, and the standard Doji.
Hammer/bullish pin bar and the inverted hammer/bearish pin bar
The hammer is a candlestick pattern that forms when the price of an instrument opens at a higher value but lowers significantly, only to come back and close near the opening price. This makes a shape that looks like a hammer (the body) with a handle (the wick).
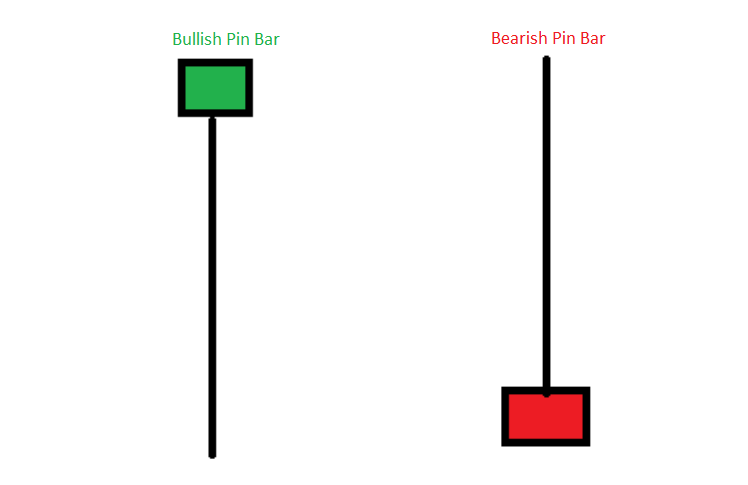
This pattern primarily signifies rejection from the downside, i.e price had significant momentum to the downside but was swiftly rejected, closing near the original opening price.
This pattern is used as a reversal pattern when it is formed at resistance lines. It also acts as a continuation signal when they start in the middle of a trend because the rejection signifies the opposite side is willing to take the price further in the primary bullish direction.
On the other hand, the inverse hammer is a candlestick pattern that forms when the price of an instrument opens at a lower value but soars up significantly, only to come back and close near the opening price. This makes a shape that looks like an inverted hammer (the body) with a handle (the wick).
This pattern primarily signifies rejection from the upside i.e., the price had high momentum to the upside but was swiftly rejected, closing near the original opening price.
This pattern is used as a reversal pattern when formed at support lines. It also acts as a continuation signal when formed in the middle of a trend because the rejection signifies the opposite side is willing to take the price further in the primary bearish direction.
“Hammer” and “bullish pin bar” are synonyms, just as “inverted hammer” and “bearish pin bar” are.
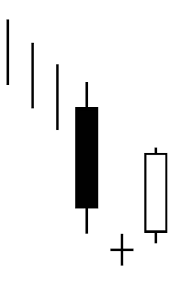
Harami
The harami candlestick pattern forms when big candles in a general trend are followed by a small-bodied candle that is completely contained in the previous big candles.
The harami signals a reversal, whether they form at the top of a bullish trend or the bottom of a bearish one.
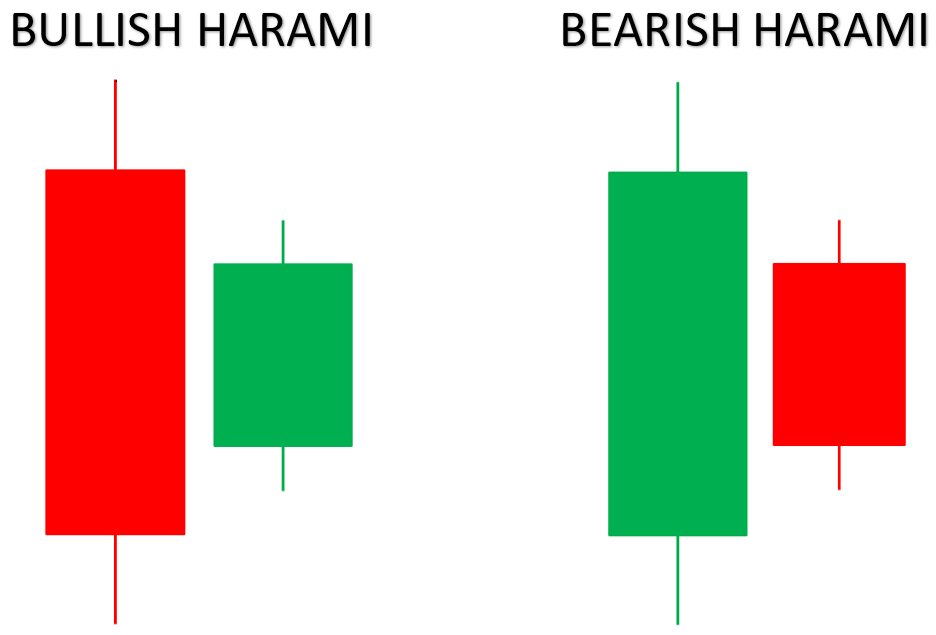
The harami is sometimes called the pregnant woman because of the structure that it forms.
The small candle must be completely contained in the larger candles preceding it. They should also only be to the right of the larger candles.
Just like most candlesticks patterns, the harami comes in two types; bullish and bearish. These tell the same stories, with the former indicating a reversal to the upside while the latter shows a possible reversal to the downside.
A harami pattern that forms at the bottom of a downtrend signifies that bears are exhausted and, therefore, an uptrend might soon be building up. This tells traders to be on the lookout to either close their sell position, hedge, or enter buy orders.
A harami pattern that forms at the top of an uptrend signifies that bulls are exhausted and, therefore, a downtrend might soon be building up. This tells traders to be on the lookout to either close their buy positions, hedge, or enter sell orders.
Bullish and bearish engulfing bars
As its name suggests, the bullish engulfing bar is formed when a candle completely engulfs or covers up the previous candle’s both highs and lows.
This candle signifies that sellers are exhausted, and bulls have jumped in with momentum to push the market, hence, covering all the previous candle’s key levels.
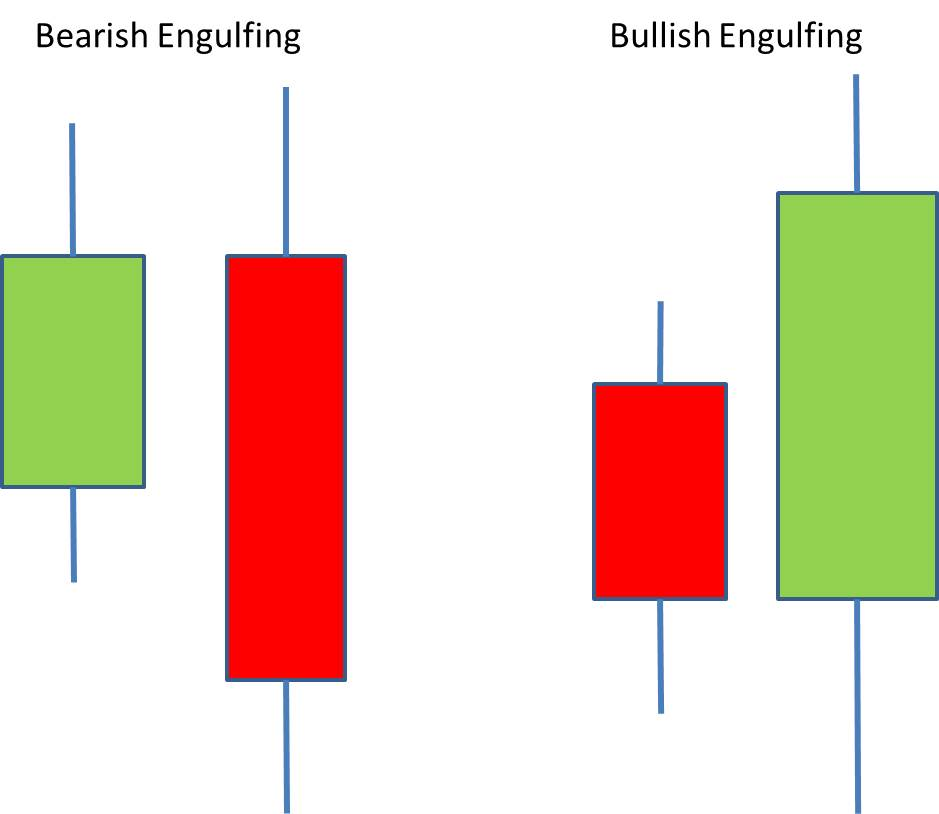
In the financial world, engulfing bars are termed the market maker candles, signifying that huge volumes have been pumped into the market.
Normally, once traders identify a bullish engulfing bar, they enter their bullish positions with the belief that the bearish trend has ended.
Bullish engulfing bars can also signal that a general bullish trend is still strong and bulls are still in control. This can signal traders to still hold on to their positions.
On the other hand, the bearish engulfing bar is formed when a candle completely engulfs or covers up the previous candle’s highs and lows.
This candle signifies that buyers are exhausted, and sellers have jumped in with momentum to push the market, hence, covering all the previous candle’s key levels.
In the financial world, engulfing bars are termed as the market maker candles, signifying that huge volumes have been sold.
Normally, once traders identify a bearish engulfing bar, they enter their bearish positions with the belief that the bullish trend has ended.
Bearish engulfing bars can also signal that a general bearish trend is still strong and bears are still in control.
Advantages and disadvantages of using candlestick patterns
Proponents and opponents of price action and technical analysis have given their views on the use of Japanese candlestick patterns. Here are the key takeaways on the advantages and disadvantages of these controversial indicators:
Advantages
-
They help determine the market's direction and actions at a glance. Every time an investor looks at the candlesticks, there's a story that they listen to, unlike the use of other chart systems, like the line chart, which just shows the direction.
-
They show four different points in every time interval, i.e, the opening, closing, high, and low, providing investors with a clear picture and a comprehensive view.
-
The color helps investors see the direction of market momentum quickly.
-
Different candlesticks combine to form patterns that can’t be found on the other charting systems available, like the line chart, which only shows a continuous flow of price in any direction.
-
They suit different time frames and can tell different stories based on the time frame you want. For example, they can show uptrends in larger time frames and downtrends in smaller time frames, with both being right.
-
Most market indicators work their best with candlestick patterns, giving clear signals.
Disadvantages
-
They present a lot of information at once, which might not be favorable for some trading strategies. Too much information can be noisy and can merely disturb clear decision-making.
-
When a false signal is presented, many traders can be fooled and lose a lot of money, as different patterns form frequently and continuously.
-
Traders may not necessarily know what came first between the high and low unless they were watching the market in real time.
-
They may present conflicting signals that, when interpreted, cause one trader to buy and another to sell simultaneously.
-
They sometimes form gaps in the market. Ordinarily, the last candle’s close should be the next candle open, but this is not always the case.

Free Resources
To continue learning and advancing your career, check out these additional helpful WSO resources:


or Want to Sign up with your social account?