


Trending Content - Off Topic Forum
| +27 | How do we get as sharp as possible? | 11 | 18h |
| +18 | Q&A | Analyst | 8 | 4d |
| +15 | Upselling yourself when you’re unqualified | 2 | 1d |
| +14 | Best way to kill time? | 13 | 11h |
| +13 | How Are Cornell 7 / GC Members Affecting Your Bank or Firm? | 5 | 2d |
| +9 | Alcoholism | 1 | 10h |
| 0 | Analyst Y1 - Messed up In First Week | 2 | 1d |
Career Resources






Interesting video, thanks for the share, JS.
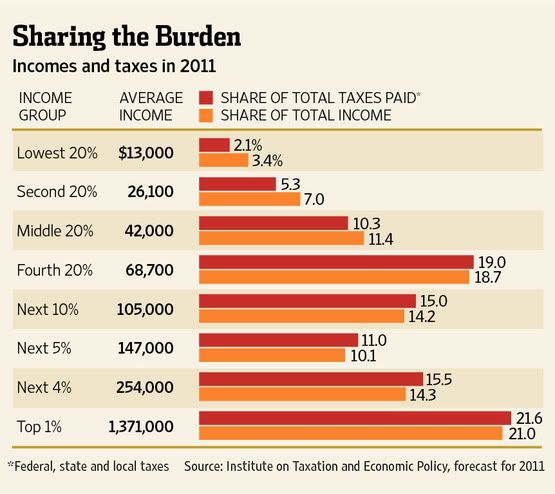
The 1% is $1.4M+?
BUT OWS SAID IT WAS ANYONE MAKING $250K+!
I think the difference here is it says "Average income" -- anyone over $250K might be in the top 1%, but the average income of all of those in that bracket is obviously going to be higher than that.
Unlikely given that the average for the "Next 4%" is $254k.
TB, what are you claiming is unlikely here, that the top 1% of earners have an average income of $1.4M? The number definitely threw me off when I first saw it, too.
I don't know whether the graphic WSJ made is pulling household incomes or individual incomes...But, let's say there are 114,235,996 households in the U.S. (Census Bureau).
According to the IRS, there were 127,997 tax returns filed in 2009 with AGI > $1.5 mill.
I am claiming that the average of the category that the graphic had labeled as "Next 4%" was $254k. If $254k is the average of the group below the top 1% then the cut-off mark of $250k actually falls somewhere around the top 3%, not the top 1%. The average for this group should be close to the mean as the outliers are all going to be encapsulated in the top 1% bucket.
Omnis et mollitia molestiae et sit reiciendis. Quis consequatur eum aut. Deleniti reprehenderit sequi esse aut nostrum. Rem excepturi et mollitia dolores.
Consectetur sint quod consectetur. Placeat inventore aliquid maxime numquam non et eligendi.
See All Comments - 100% Free
WSO depends on everyone being able to pitch in when they know something. Unlock with your email and get bonus: 6 financial modeling lessons free ($199 value)
or Unlock with your social account...