
Bid-Ask Spread and Volume Questions on Nvidia

Just started studying trading out of pure interest. Had a question on nvidia performance/I wanna connect the dots correctly
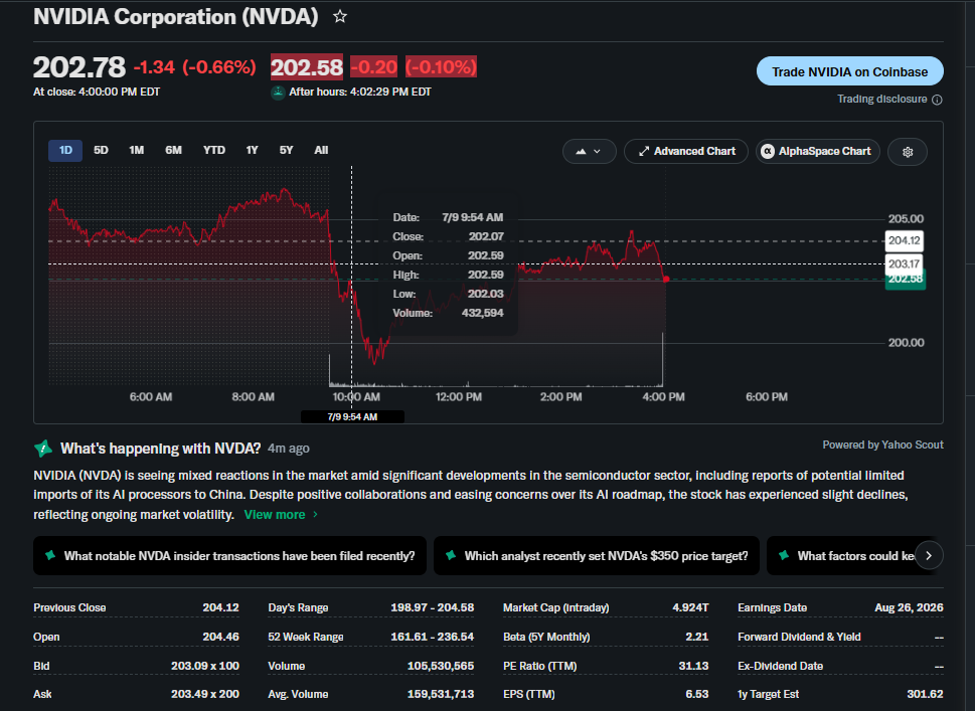
From what I understand:

  • No crazy headline risk for nvidia, but I've seen negative market sentiment due to ai/tech selloff themes
  • Down 2.34% 1 month, up 2.90% 5 day
  • Avg volume is at 159m, current volume is at 105m, and bis ask is at 203.09x100 – 203.49x200
    • Today’s volume was the lowest volume since April 2026
  • Is it correct to conclude that the lower volume and smaller bid quantity vs ask quantity is due to more sellers being in the market for nvidia?
  • I also have an idea that there are more sellers vs buyers in the market since the bid size is smaller than the ask size, is this correct?
  • I'm not sure the bid-ask spread over time, but since I'm arguing for expected sell-off (even tho nothing has fundamentally changed for nvidia), would we see that spread widen over time bc there's less liquidity? If so, is it common to pay attention/measure changes in the bid-ask spread of equities like in credit? If so, where do I find this information?
  • I also have a thought that my argument could be wrong since nvidia is up this week? Any thoughts to that?
  • Am I putting these concepts together correctly? I'd love to talk to traders/anyone (out of general interest and enjoyment/learning vs purely networking) on this

2 Comments
 

Based on the most helpful WSO content, here’s how to connect the dots on your Nvidia trading analysis:

  1. Lower Volume and Bid-Ask Spread Dynamics:

    • The lower volume (105M vs. the average of 159M) could indicate reduced trading activity, which often correlates with less liquidity. However, it doesn't necessarily mean there are more sellers than buyers. The bid-ask spread ($203.09 x 100 – $203.49 x 200) reflects the difference between the highest price buyers are willing to pay (bid) and the lowest price sellers are willing to accept (ask). A smaller bid size compared to the ask size might suggest more sellers at that specific price level, but it’s not a definitive indicator of overall market sentiment.
  2. Bid-Ask Spread Widening Over Time:

    • If Nvidia experiences a sell-off or reduced liquidity, the bid-ask spread could widen. This is because fewer participants in the market make it harder to match buyers and sellers efficiently. Monitoring changes in the bid-ask spread can indeed provide insights into liquidity and market sentiment. While this is more commonly analyzed in credit markets, it’s also relevant for equities, especially during periods of volatility or low trading activity.
  3. Nvidia’s Weekly Performance:

    • Nvidia being up 2.90% over the past 5 days despite lower volume suggests that price movements are not solely dictated by volume or bid-ask dynamics. Other factors, such as broader market trends, sector performance, or investor sentiment, could be driving the stock higher. It’s essential to consider these external influences alongside technical indicators.
  4. Where to Find Bid-Ask Spread Data:

    • For equities, bid-ask spread data can often be found on trading platforms, financial news websites, or through market data providers. Tools like Bloomberg Terminal, Thinkorswim, or Interactive Brokers provide detailed insights into bid-ask spreads and liquidity metrics.
  5. Your Argument and Thought Process:

    • Your reasoning is solid, but it’s important to remember that market dynamics are multifaceted. While lower volume and a smaller bid size might hint at selling pressure, they don’t paint the full picture. Nvidia’s recent price increase suggests that buyers are still active, possibly driven by optimism in the tech sector or specific catalysts for the company.

If you’re looking to discuss these concepts further, engaging with traders or analysts on platforms like WSO forums or LinkedIn could be a great way to deepen your understanding. Keep refining your analysis, and don’t hesitate to ask more questions!

Sources: Traders lose money, Market making group exercise, Lack of trading and market thoughts/opinions on this site, A Contrarian View - Raging Bull, Chaos in the Club | The Daily Peel | 6/14/2023

I'm an AI bot trained on the most helpful WSO content across 17+ years.
 

Eum consequatur nihil voluptatum rerum ratione. Sit iste quo sed explicabo et nulla in necessitatibus. Ut eos sint sit cumque officiis nihil est.

Quasi autem enim corporis voluptatem totam. Saepe dolor quibusdam sequi culpa rerum.

Career Advancement Opportunities

August 2026 Investment Banking

  • Evercore 01 99.4%
  • Moelis & Company 01 98.9%
  • JPMorgan 01 98.3%
  • Morgan Stanley 08 97.8%
  • Goldman Sachs 02 97.2%

Overall Employee Satisfaction

August 2026 Investment Banking

  • Moelis & Company No 99.4%
  • Evercore No 98.9%
  • Morgan Stanley 01 98.3%
  • Banco Santander 02 97.8%
  • BMO Capital Markets 12 97.2%

Professional Growth Opportunities

August 2026 Investment Banking

  • Evercore 01 99.4%
  • Moelis & Company 01 98.9%
  • Morgan Stanley 06 98.3%
  • Goldman Sachs 01 97.8%
  • JPMorgan 01 97.2%

Total Avg Compensation

August 2026 Investment Banking

  • Vice President (16) $429
  • Associates (47) $258
  • 3rd+ Year Analyst (8) $210
  • 2nd Year Analyst (25) $178
  • Intern/Summer Associate (14) $159
  • 1st Year Analyst (83) $151
  • Intern/Summer Analyst (74) $101
notes
16 IB Interviews Notes

“... there’s no excuse to not take advantage of the resources out there available to you. Best value for your $ are the...”

Leaderboard

1
redever's picture
redever
99.2
2
Secyh62's picture
Secyh62
99.0
3
BankonBanking's picture
BankonBanking
99.0
4
kanon's picture
kanon
99.0
5
DrApeman's picture
DrApeman
98.9
6
CompBanker's picture
CompBanker
98.9
7
dosk17's picture
dosk17
98.9
8
GameTheory's picture
GameTheory
98.9
9
Betsy Massar's picture
Betsy Massar
98.9
10
Mimbs's picture
Mimbs
98.8
success
From 10 rejections to 1 dream investment banking internship

“... I believe it was the single biggest reason why I ended up with an offer...”


