First Steps into Trading
General Note: The purpose of this blog is to provide commentary on my simulated trading experience. It is mainly aimed to students and graduates interested in a career in trading and looking for ways to improve their knowledge of the field by providing them examples of the material I have found helpful so far. Comments from professionals are nonetheless welcome. The trading simulation is hosted by stockfuse.com.
Introduction:
I started my two portfolios approximately last December, trading stocks listed on the London Stock Exchange and Exchanged Traded Funds listed on the New York Stock Exchange. While I make some ‘’real markets’’ experience, I try to expand my knowledge reading blogs and books on the topic. One that has been particularly influential so far is ‘’Market Wizards’’ by Jack D. Schwager. It’s a series of interviews with some of the most profitable traders until 1989 and provided me a number of key principles I would say anyone who starts trading should keep in mind:
• There isn’t a single correct way to make money. Some make money following trends, some make money on ‘’reversals’’, some trading a single product, others by trading everything. • If you have a strategy, stick to it. The easiest way to lose money is to chase the market because it is not going in the direction you thought. • Have a stop loss. Stop loss is the maximum amount you are willing to lose on a single trade. Just like there isn’t a single way to make money, there isn’t a single method to ‘’stop the losses’’. It is completely arbitrary, what is important is that you stick to your own method. • Don’t take tips. It isn’t trading. Someone else is trading and you are completely dependent on them.
The Good and the Bad:
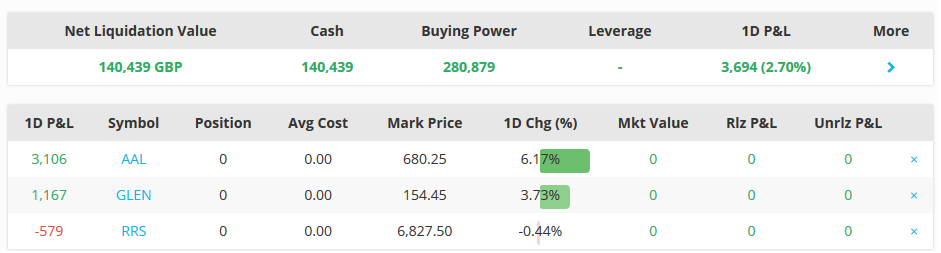
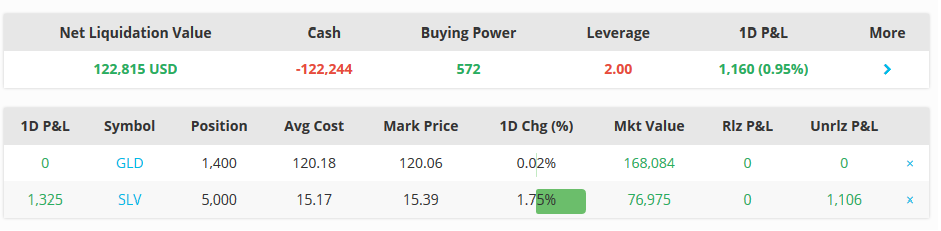
So, how would I judge my first 4 months of trading? December was the time of rookie mistakes, January was great, February was ok, March was nasty. In April so far I’m doing well, learning from the mistake of the previous month. During December I basically did the opposite of what I just described above; by January I had learned to stick to my strategy and the value of my portfolios went from 100,000$ (or £ in the LSE portfolio) to 166,000$ and 171,000£. I will describe my strategy in details below. During one of those days I thought ‘’wow, trading is easy’’. By the time March was over I was down to 119,000£ and 117,000$. Not only I lost more than half of the returns I had made, but I lost for 6 weeks consecutively, often losing for four days out of five business days. That hurt. The first half of April is being satisfactory. I'm back to +40% and +22%.
See the attachments for the screenshots of my portfolios
Lessons learned: • Markets can make you poor as easily and as fast as they make you rich. • Know when to get out. (I understood the importance of having a stop loss in March) • Diversification is a hedge for ignorance (William O’Neill in ‘’Market Wizards’’).
The Ongoing Strategy:
My primary choice has been short-selling the energy and commodities industry. I read various explanations about the collapse of oil prices last year, ranging from the oversupply, to a market share war between Saudi Arabia and Russia, or Saudi Arabia and the shale oil industry of the US, I’d personally add that the Islamic State selling oil at 30$ per barrel in the black market did not help either; whatever you want to believe it does not change the reality of oil prices, hence shorting LON:TLW, NYSEARCA:USO. As it affects the whole industry, it makes little sense to me focusing on the fundamentals of companies, thus I regularly switched to LON:BP, LON:RDSB or NYSEARCA:OIL.
Additionally, the low copper prices due to the slowing down of the Chinese economic growth add pressure to those companies that operate in both the oil and metal industries: LON:RIO, whose core operations are in Australia, a major exporter of metals to China, and interchangeably LON:AAL or LON:GLEN proved so far to be satisfactory picks.
What happened in the second half of February and March, the 50% surge in oil prices, seems to be explained by the mass liquidation of short positions. Mark Weinstein in Market Wizards says that ‘’people taking profits’’ is often misunderstood, the reality is that they are cutting losses. It might as well be true. In a hindsight, since I did not know what was going on, I should have stayed out. Lesson for the future. I tend to agree with this explanation; the reasons behind the short logic are still standing, the Baltic Dry Index collapse additionally points towards a return to the downward trend, thus I resumed my strategy, though I might temporarily get out as we approach an important meeting of the oil producing countries in the second half of April.
The above mentioned index collapse paired with a number of reasons indicating the possibility of a recession ahead for the US lead me to buy LON:RRS, a gold mining company and NYSEARCA:GLD in late December. I originally bought 1800 stocks of Randgold Resources at approximately 4700£ and liquidated at the end of January at 6000£ , which has proved to be my best trade so far. I remain bullish on gold, thus after taking profits at 6000£ and again at 6200£ I recently reopened the position. An alternative to gold is the so called ‘’volatility index’’ NYSEARCA:VXX, the Standard & Poor’s short-term futures indicator of the anxiety and fear of markets.
| Attachment | Size |
|---|---|
| Profits London 34.5 KB | 34.5 KB |
| Profits ETFs 31.27 KB | 31.27 KB |


The first thing you should realize when trading, is that both fundamental analysis and technical analysis are required. Fundamental analysis will help you understand the long term direction of a market (and only if you are right), but technical analysis will govern the short term price action of how market will get to that long term objective.
Knowing where an asset price will be 1-3 years, or in 1-3 months, in the future will do NOTHING to help you make (or lose) money trading an any 1 trading day.
The more leverage embedded in a market (leverage here defined as %of float held short), the more technical analysis will govern the price action of an asset. Why? Because leverage creates more opportunity to create volatility, and volatility creates more opportunity to squeeze out levered positions. This fact should keep market participants from using too much leverage...but human nature (fear and greed) overcomes this fact. People are emotional, and emotions are the cause of pretty much all human suffering, and most trading losses.
So, how can this information help you? First, you need to find a method of technical analysis that accurately describes the price action of your market. For some markets, a bollinger band is a great predictor of price action.
Lets zoom in on the bollinger band.....just as an example. A classic Bollinger Band (BB) is a 20bar simple moving average of closing prices, and a 2 standard deviation band (both above and below the BB moving average). A bar can be a day, a week, a month, or 5 minutes (or any other time frame). Depending on a markets volatility, you will need to choose the bar size (and # of standard deviations) that best describes the price action of your market.
I trade mostly 30yr bonds (and bond futures, so ZB is the futures ticker)...and i find that the 4hr and 30min bars with 3 standard deviation BBands are the most descriptive for my market (i actually add some other adjustments, but this will get you 80% of the way there)...so i look at multiple time frames. However, that's not enough. you must understand how positioning works in your market. (are central banks directly involved? Pension Funds?, banks?, hedge funds?, CTAs? Trend followers?) What are the calendar of known events?
How do traders "setup" for these events? You must also understand "how your technical indicator describes your market". For the BB, the bands expand and contract as buyers and sellers battle, and ultimately price "settles" into a stable state (stable for the time period you are looking at).
I could go on, and spend hours talking just about how to use a Bollinger Band (do you want to know how deep the rabbit hole goes?)..but i think you get the point. Trading is incredibly intensive. You are trying to predict the behavior of the crowd...many large participants, all with differing views. Add your own bias to the mix, and predicting price action (while not impossible, sometimes) is incredibly difficult. Perhaps one of the hardest intellectual pursuits. Some large hedge fund might believe that a company is fraudulent, and then bet with leverage that the stock price will go to zero...but then the market price might rally, and that hedge fund might get squeezed out of their short position because of too much P&L pain. Even if ultimately, their thesis turns out to be correct. Knowing where an asset price will ultimately go does not guarantee that you will make money trading an asset, because you need to not only be correct about the future price, you also need to be correct about the PATH of future prices.
It will take you years to become proficient at this...and even after that, there is no guarantee that you will be successful.
This is not to say that you will not be successful....or that you will ever be able to accurately predict the path of future prices...but the more you learn, the more you will discover that you do not yet know. This should not dissuade you from seeking education and knowledge. Right now, you are completely blind. First we need to open your eyes...then we can start to teach you how to focus your eyes, and then we can teach you pattern recognition. First you must learn how to walk, then yo can try to fly.
If you skip these steps, you will most likely just fall down and fail.
"WE" are the market....and we teach only thru pain, and experience.
Honestly, this is cool and all, but there's a reason everyone is a great paper trader. Personally, I think it's very dangerous to overly buy into technical analysis. To me, there is too much proof in the randomness of prices, and at the end of the day, fundamental analysis and macroeconomics drive prices, not chart patterns (maybe over the extreme short term, but then that's not a very viable long term strategy).
Read The Misbehavior of Markets as a counterpoint to your trading education. Too much of TA is self-fulfilling BS.