The duality problem in volume analysis
Beginners often have the illusion that making trading decisions is quite simple – just spot a large positive delta on the chart, which indicates a big player, and follow their buying logic.
But it is not that simple.
Having noticed large volumes, you need to ask yourself basic questions:
- Is it buying or selling?
- Whose buying or selling is it – professional traders or retail buyers? What motivates their decisions?
For example, let’s consider a simplified cycle that occurs repeatedly on any exchange, whether for stocks, cryptocurrencies, or any other asset.
TREND DIAGRAM
Below is a diagram of a bullish trend (the opposite is true for a bearish one).
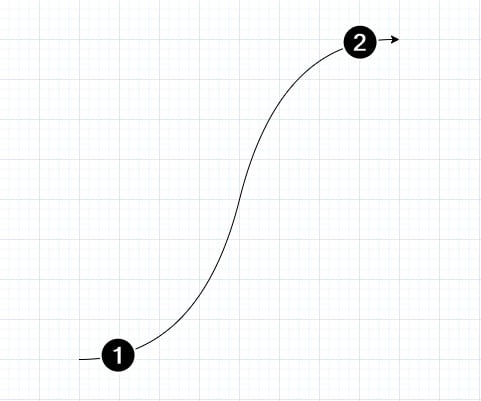
The arrow above shows the price increase, the numbers indicate:
- Trend emergence period – when professional participants enter long positions: large hedge funds, experienced investors. They make decisions based on the findings of analyst teams, complex mathematical models, insider information and other information that is inaccessible to most traders due to its value.
- Trend culmination period – when a lot of retail traders enter a long position. During this period, the uptrend becomes too obvious – it can be seen in the price rise, optimistic comments from the “gurus”, and media headlines. It is usually too late to go long at this stage.
In both cases, you can see prints of large buys on the chart.
However, in the first case, it indicates the activity of a big player, which may serve as a rationale for your own purchases that align with their intentions.
In the second case, you may follow the herd instinct or succumb to the FOMO effect, which is the fear of missing out on potential profits. Either way, trading is risky.
The following chart will help you better understand what we are talking about. This is a footprint from the futures market for the DAX stock index.
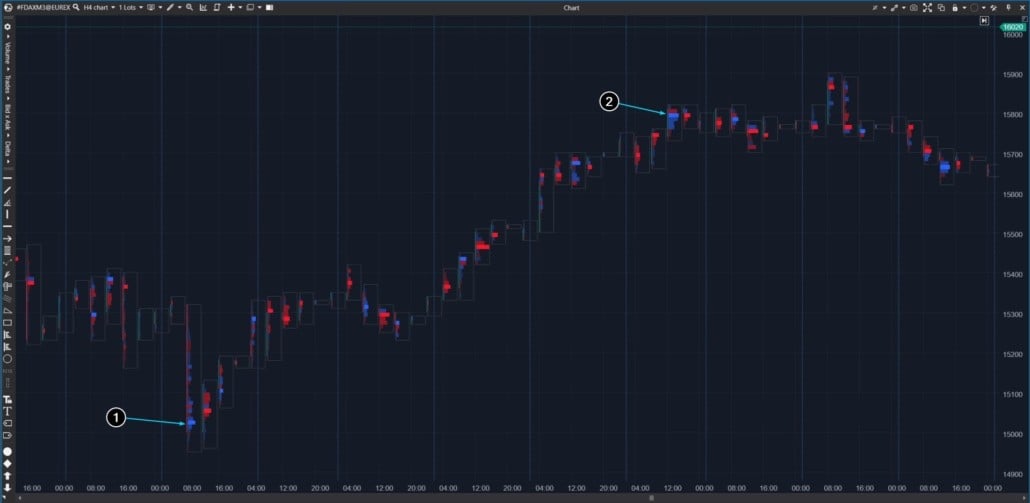
Numbers indicate:
- Buys that were probably made by a major player after the release of important economic news. Perhaps the first reaction to the news was wrong and led to local panic, and the professional decided to take advantage of the low prices.
- Demand from a lot of retail traders after a price increase and positive media coverage. As one might suspect, it is being met by a large player who is closing his long position at a profit.
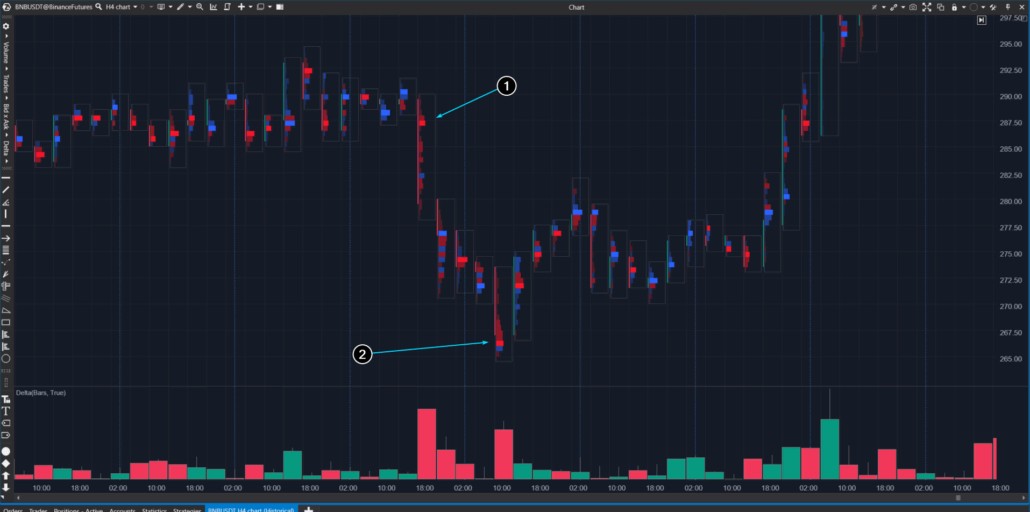
And this is how the sales of large players (1) and the mass of retail traders (2) look in the context of a downward movement (an example from the Binance Futures exchange):
In trading, you constantly face different dilemmas:
- the price can go up or down;
- the price can move on high and low volumes;
- volumes can represent buys and sells;
- buying and selling can represent totally different motives for professional traders and the mass of retail traders.
The solution to the problem of duality in volume analysis is not to focus specifically on single prints but to form your own judgment based on the larger picture.
When analyzing large volumes, consider the context of their appearance. As Tom Williams, creator of the VSA, said: “It can be either a polar bear in the Arctic or a polar bear in Africa.”
If you want to gain a better understanding of how to use VSA for footprint analysis, check out this series of articles at the ATAS website.


Vel qui dolore laudantium ipsum. Molestiae non sequi quas dolores. Consectetur vel consequatur nisi ipsum. Et perferendis totam non id tempore aut nam. Voluptatibus veniam consequuntur architecto libero. Sint commodi omnis maxime velit. Sequi consequatur aliquid doloribus et ut in nihil.
Eligendi architecto dolorum qui molestiae asperiores. Officia esse veniam quaerat dolore. Temporibus qui aspernatur ducimus. Sint explicabo quos ratione asperiores dolor harum repellendus.
Dicta aut quia ratione molestiae odit natus ut. Vero voluptas omnis quae explicabo. Dolor dolor voluptas debitis est a aperiam sint. Debitis magnam doloremque sit deleniti.
See All Comments - 100% Free
WSO depends on everyone being able to pitch in when they know something. Unlock with your email and get bonus: 6 financial modeling lessons free ($199 value)
or Unlock with your social account...