Hope you're all well. I saw some misinformation spread in another thread and wanted to clear the air regarding U.S. league tables, as FactSet has finally released the 2020 Flashwire report.
Each data provider has its own criteria as to which deals are included and each bank uses whichever puts them nearest to the top. In an effort to bring about some more transparency, below are the primary sources for league tables.
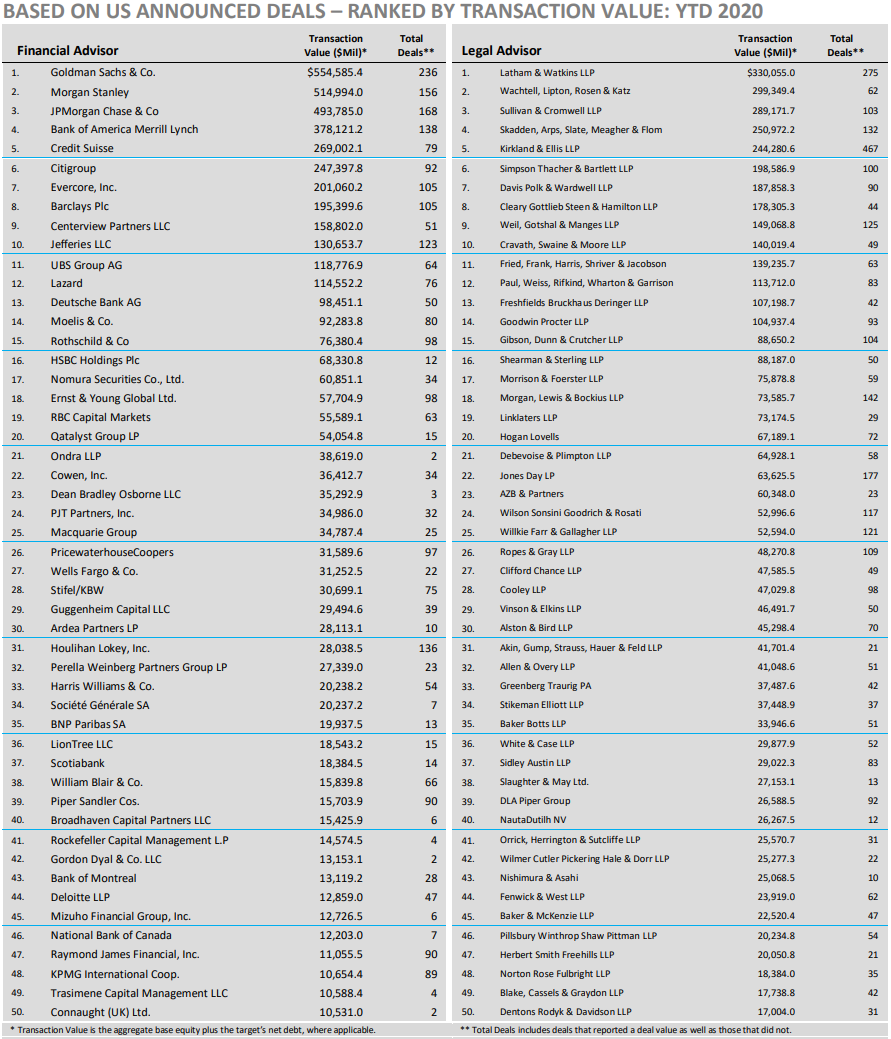
1) FactSet: generally the data provider bankers are most familiar with (at least according to a small but diverse sample of my friends at top banks). Each month they publish the Flashwire US report, and it's what most bankers reference. I definitely trust these numbers the most, though no data provider is perfect and there will definitely be discrepancies in deal values as you go below the top 15 or so banks.
Here's a link to it: US-Flashwire-Monthly.pdf (factset.com)
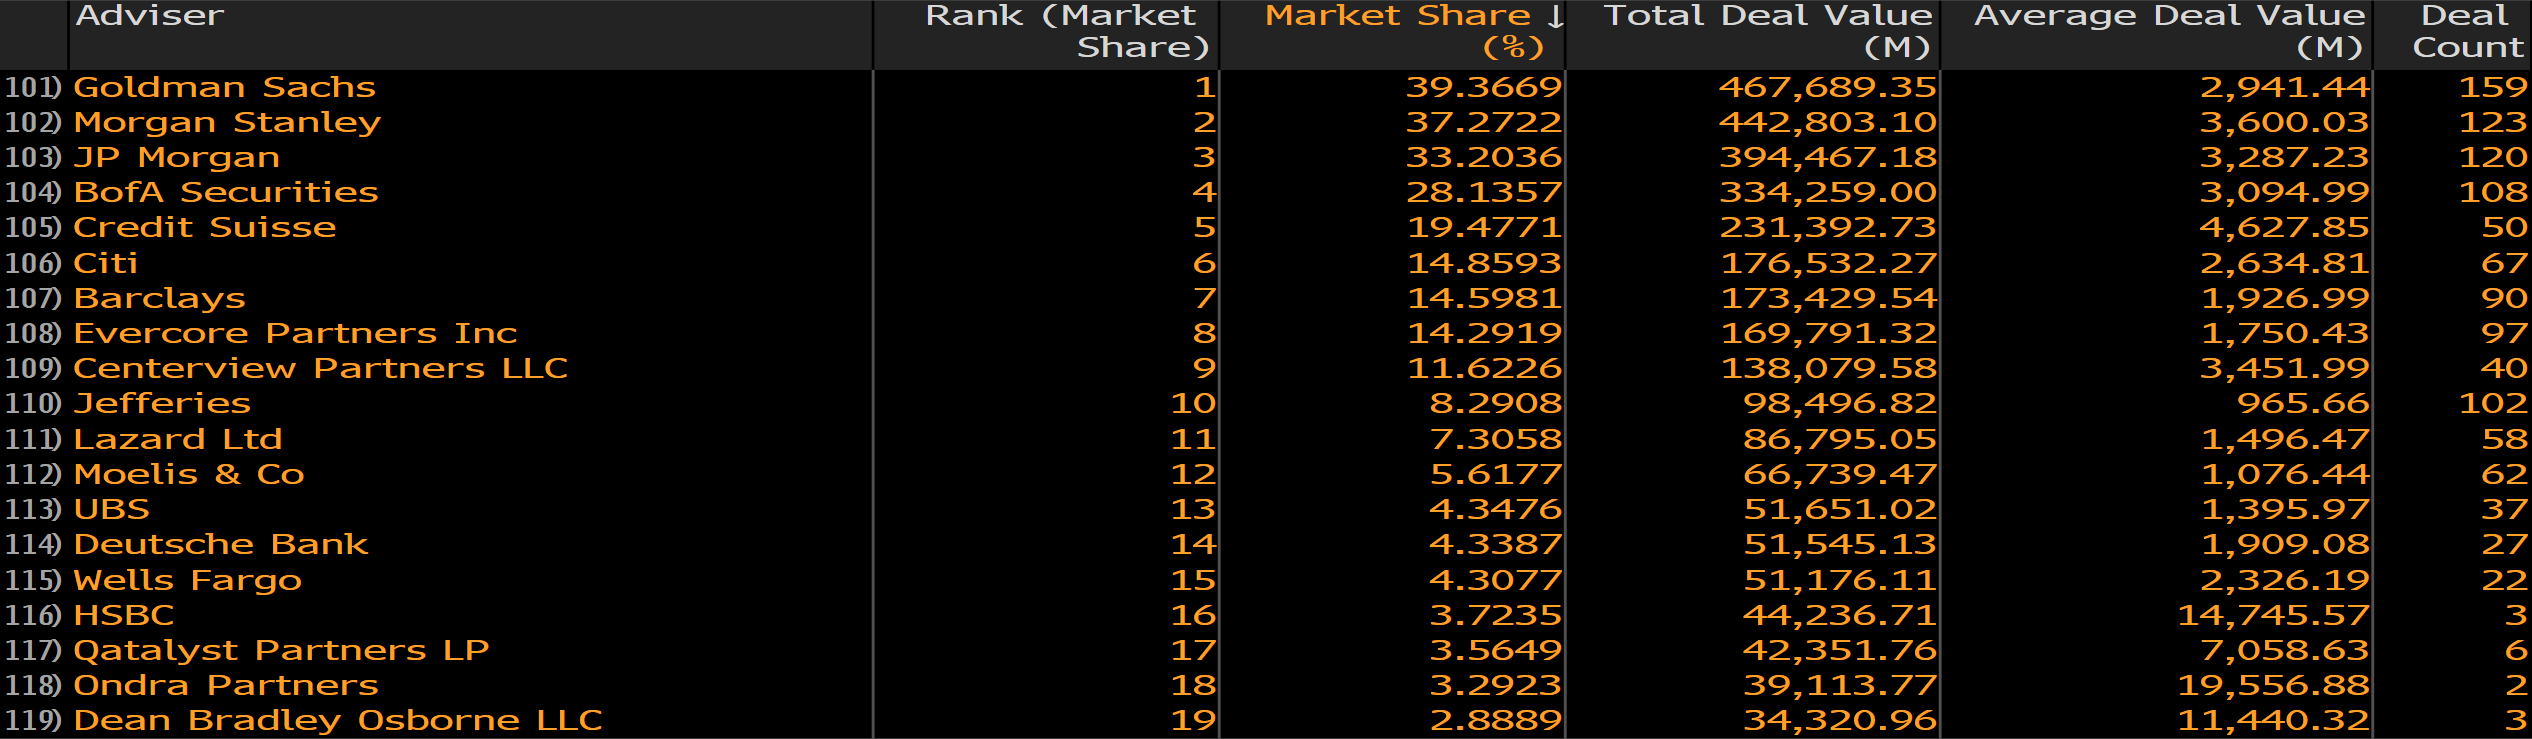
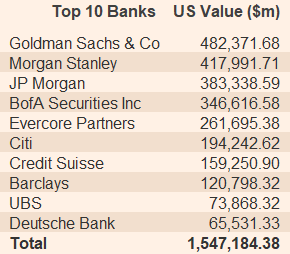
2) Bloomberg: as a student, I thought this was what bankers used. Turns out no one really uses it (and for good reason, it's easily the ugliest platform I've ever looked at). To my knowledge Bloomberg doesn't publish a similar report to FactSet but if I'm wrong please correct me. I've posted the results I got using the <MA> command and filtering for M&A deals announced in 2020 pending or completed in the U.S. Output is below. You'll notice the order of the list is different, as well as the deal values.
--- these are pretty much the only two data providers I trust and, as you can see, they say different things. Below are a few more that I don't personally use but that are quick and easy to access. ---
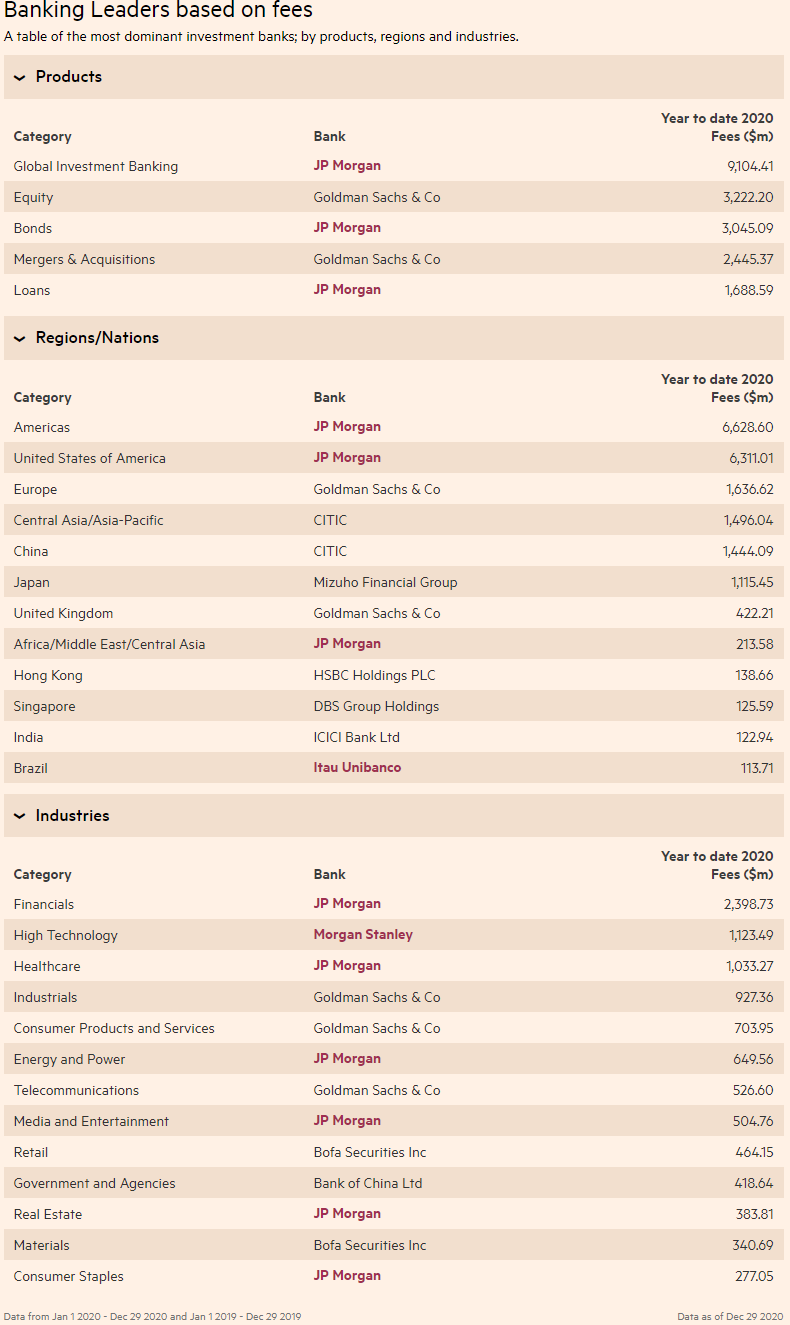
3) Refinitiv: formerly the Financial & Risk business of Thomson Reuters. Can't seem to locate the deal list so would take this with a grain of salt.
Here's the link to it: League Tables – Investment Banking Review – FT.com
They let you sort by fees too which is kind of cool but not particularly helpful.
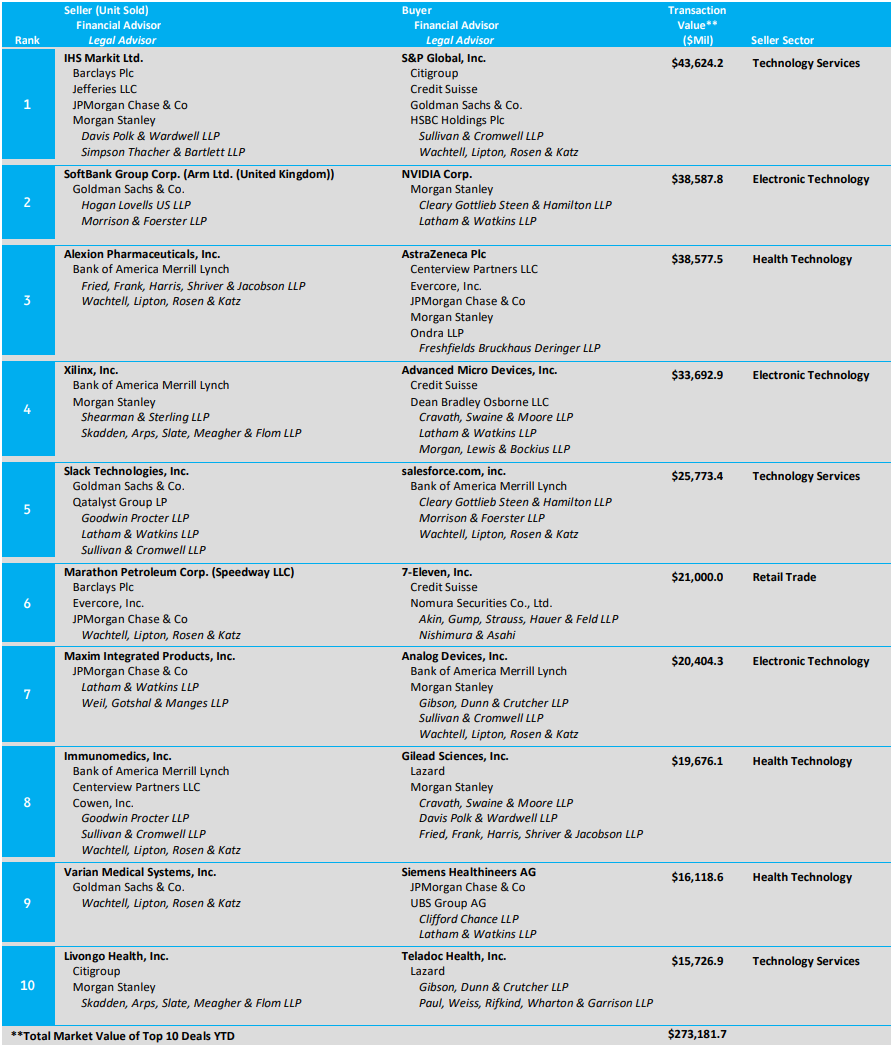
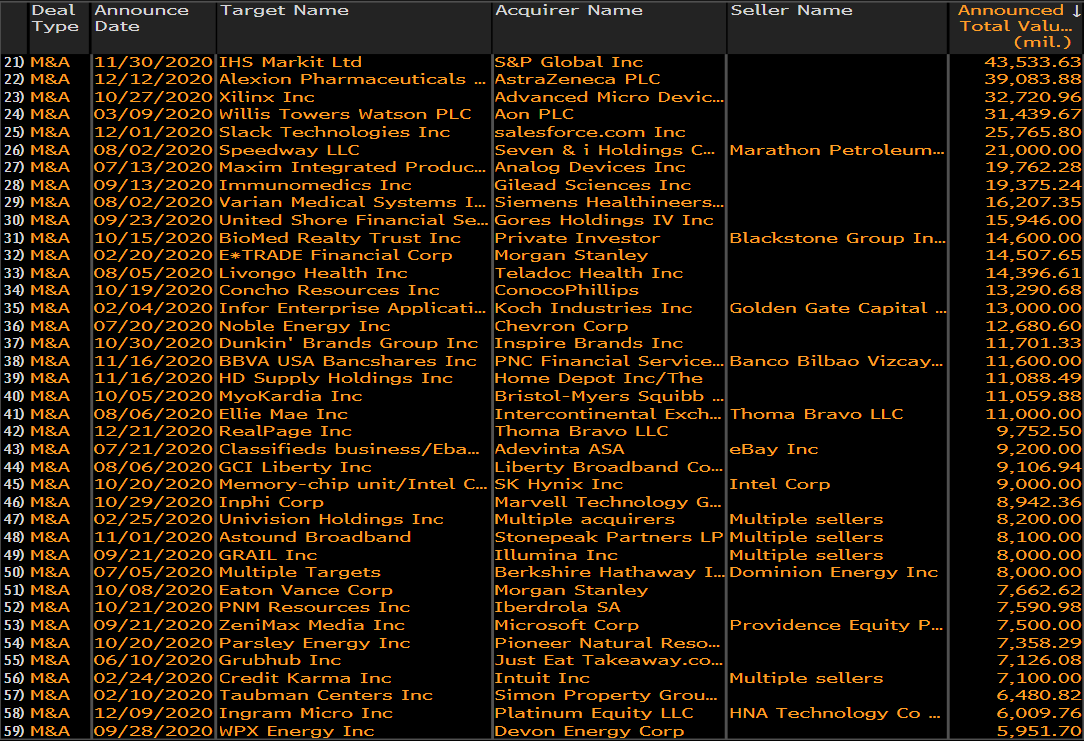
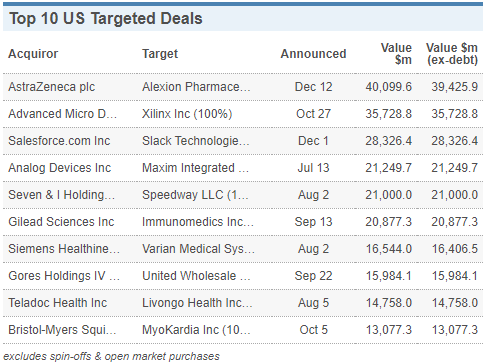
4) Dealogic: my group has had problems with Dealogic in the past so I don't trust them. You can see they exclude the IHS Markit deal (which was the biggest deal announced and one that a ton of banks were on) as well as the Arm deal (second biggest). This artificially deflates Barclays, Jefferies, JPM, MS, Citi, CS, GS, and HSBC on IHS-S&P and GS and MS on Arm-NVIDIA. Adjusting for those looks like top 5 should match FactSet and Bloomberg.
Here's a link to it: Investment Banking Scorecard - WSJ.com
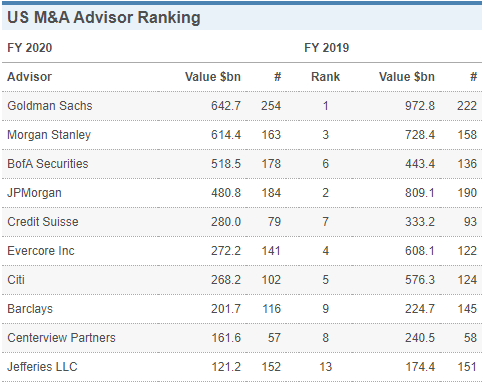
Looking at all of the league tables and based on what I saw in the market, top 5 for 2020 is as follows:
3) JP Morgan


Sick
In Europe most banks tend to use Dealogic rather than factset, which idk if it has any specific reason
Anyways, Dealogic did count the ARM deal at least as we updated our credentials for a pitch and it did show in the league tables
Jefferies underappreciated on WSO
100%. Jef a BB.
Jef is sweat shop that does most deals in MM - Look at their deal counts and average size
That is true, but anywhere with good deal flow is a sweatshop. Being top 10 in the league tables with mostly MM deal flow is a feat in itself, but also clearly not true. The reason they're so high is that they have a mix of MM and bigger deals. Regardless of which, the analyst experience is going to be great compared to many other places in terms of exposure/experience
Couple observations:
-JP/GS/MS clear top three. But gap between BofA and its "peers" is interesting. CS/Citi/Barc are typically considered BofA peers, but there is a >$100m gap between BofA and CS or Citi and nearly a $200m gap with BofA and Barc.
-Barc has traditionally been considered the "strongest" European BB operating in America because of the Lehman acquisition and Jes Staley's JPM IB pedigree. Doesn't appear to be the case when you compare to CS or is this a one off year?
-Jefferies undeniably coming on strong. They have allowed clients to play with leverage to a degree that others though irresponsible but it looks like they have the last laugh.
-We will need to see how the rx fees come in (not included here) to see how the EBs are really doing but no matter what, rx did not turn out to be as counter-cyclical as liquidity services in a non-financial crisis. The counter-cyclical argument of Rx relative to bulges has been a chief selling point of the EB model so this refutation relative to liquidity services is interesting.
-Why isn't WFC doing better given their balance sheet? They should have eaten in the debt market.
CS/BARC/Citi are only considered to be BofA's peers on WSO and I think that's because junior banker exits are somewhat similar across those banks and clearly worse than the top 3.
But most bankers would rate BofA in its own tier below the top 3 with Citi a clear 5th. The last 10 years of league tables across all products back that up.
Wells Fargo does crush it in DCM and I think they're like 10th in overall fees but not as strong in M&A - I think that's more due to quality of MDs vs the other big balance sheet banks who all have M&A practices which could stand on their own.
Yeah, WF analysts who are honest will agree, it’s a capital markets IB. Yes, they might do a few m&a deals but not as much as other banks. One of the 2nd years there hasn’t worked on a m&a deal in a cov group but always talks about the “m&a pipeline”
WF's IB lost a ton of bankers of the past five years and this is M&A only per the title
Biggest shockers to me are EY/PwC being as high as they are. Does this also count things like Fairness Opinions towards the total?
DB definitely getting back on their feet
The fuck is DBO
I actually think the Factset data looks the worst. E&Y, PWC are not real players in US M&A.
Totally forgot about mergermarket but a friend just reminded me of them. Much like Factset they publish reports for both financial advisors and legal advisors. Here's a link: https://www.mergermarket.com/info/publications-data-capture?documentId=…
Just fyi, at least at my BB, Dealogic is pretty much always used (London). The above table most likely includes the IHS markit deal but the list of transactions shown on the scorecard only ever includes US targeted deals. As IHS is London headquartered, it makes sense for it to be absent.
How did HSBC and Nomura make such big jumps on the league table? Are they really growing M&A in US?
Not so dirty little secret, M&A league tables generally mean fk all. Half the time, lending banks (BBs) will participate as deal financing only and will beg for M&A credit to pad their stats, even though they did nothing on the actual M&A side of the deal. Hence why some banks have elevated placements in the table. From where I sit, on the BB side I see GS, JPM and MS the most by far.
Not bashing or anything but it's funny that the only reason DBO is up there is because of the Xilinx deal, $33/$35bill of it's total deal value
Explicabo molestiae expedita praesentium provident quidem. Aut aut iusto totam fuga animi. Voluptatem at recusandae in illo tempora est. Fuga rerum omnis eos eius libero cupiditate omnis ut. Deserunt assumenda ut voluptates ut rerum.
Dolores eligendi dolore sapiente odit voluptates. Hic praesentium nobis dolore consequatur. Dolor molestias ullam delectus commodi corrupti soluta.
Ducimus doloremque quos est. Dolorum recusandae quia quia officiis suscipit. Sint vitae quisquam aut accusantium ratione.
Et eaque asperiores rem deleniti possimus. Neque repellendus nam reprehenderit autem. Et accusamus sed distinctio aliquam quisquam ullam aut voluptatem.
See All Comments - 100% Free
WSO depends on everyone being able to pitch in when they know something. Unlock with your email and get bonus: 6 financial modeling lessons free ($199 value)
or Unlock with your social account...