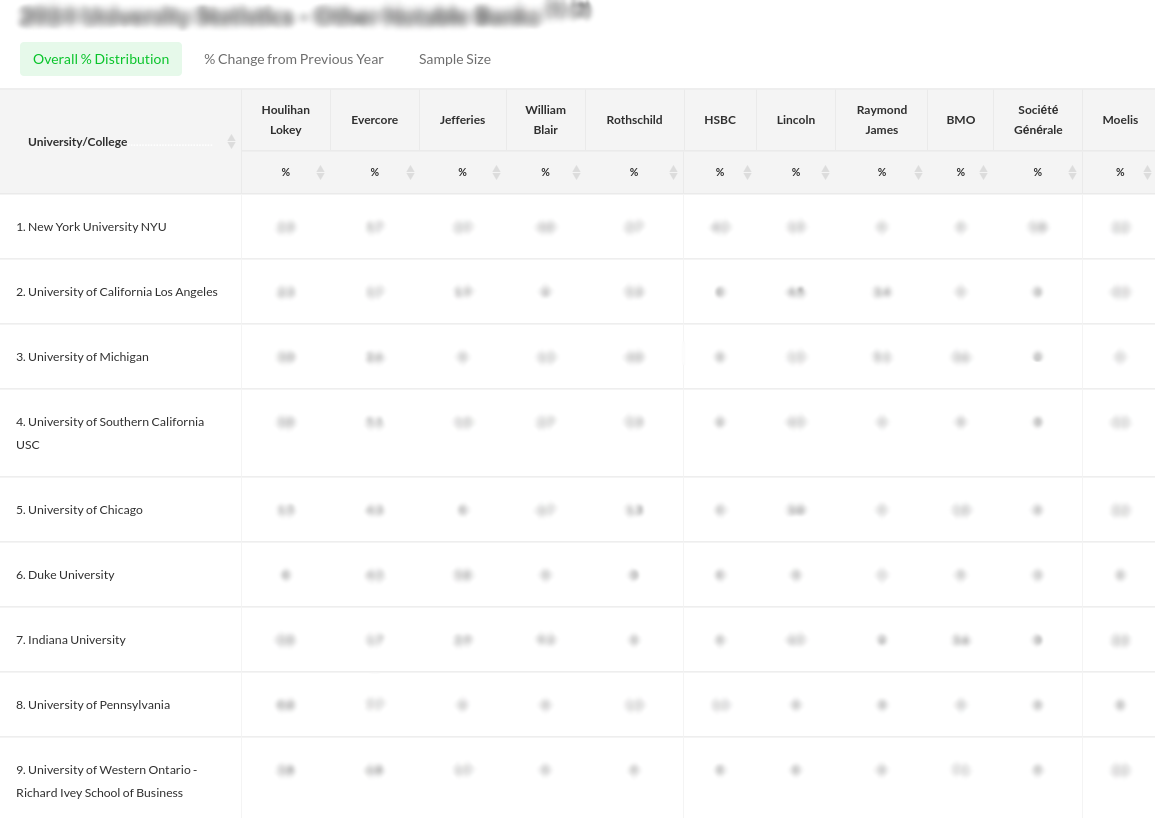
University Statistics - Employment and Recruiting Trends
The university statistics section is a way for you to see what undergraduate institutions firms recruit and hire from most frequently. The tables can be toggled to three different versions. The first is overall percentage distribution which shows the overall percentage of submissions from each firm by school. The second is "% change from the previous year" which shows the percentage change in the overall distribution % from the prior year WSO report. Lastly, the Sample Size table is to show how many submissions were collected on each school by firm during the reporting year. Note: similar to the compensation section, the university statistics reported here each year include the previous two years and YTD submissions to help smooth out noise in the data.
Get Full Access
- Free 1 month access by adding just 1 salary datapoint here
- REAL salary bonus data across 1,000+ companies
- Plus free 1 month access to 10,000+ interview insights
Get Full Access
- Free 1 month access by adding just 1 salary datapoint here
- REAL salary bonus data across 1,000+ companies
- Plus free 1 month access to 10,000+ interview insights
Thousands of Interview Questions Available by Firm
Methodology FAQ
How often is this data updated?
The rankings are constantly changing and evolving based on additional data we collect every day. The graphs and tables use the data from YTD and the prior 2 years. See tabs located above on this page to access previous year rankings.
Why do the average compensation numbers look so low?
Remember that the compensation you are accustomed to hearing for top performers in the top groups in New York is well above the average for cities around the world. The compensation average graphs are a global average which includes regional cities and groups that bring the average down. If you would like company and group specific compensation data, please visit the WSO Company Database.
Where does this data come from?
The compensation, review and interview data comes from WSO member submissions to the WSO Company Database. With over 50,000 submissions to date across thousands of companies, the database is solely a representation of what our members were paid and how they rank companies on various metrics. Please see below for a detailed breakdown of the member statistics for those that have contributed to the database.
What are the percentile rankings based on?
The percentile rankings of companies listed here are based on the current YTD and the prior two years of data for companies that received at least one vote. The simple average scores are converted into an Adjusted Score before the companies are ranked to take into account companies with a smaller sample size. This method uses Bayesian Statistics.
Why do you use Bayesian Statistics to adjust scores?
This methodology is used in order to account for standard deviation in rankings. As a company gets more rankings and data, we have more confidence that the average ranking is a true reflection of reality, so this is reflected in the adjusted scores and Percentile rankings. Learn more about Bayesian Statistics here.
Why don't I see company XYZ?
Some great smaller firms may not be represented in the rankings for the simple reason that we have not collected enough data to represent them accurately or for us to have enough data to display them at all.
What is the geographical representation of the submissions?
The WSO user base is very US-centric with approximately 70% of all submissions coming within the United States of America. Please see the detailed breakdown of the member statistics for those that have contributed to the database. For more company and city specific compensation, please visit the WSO Company Database.


or Want to Sign up with your social account?