CHISQ.TEST Function
An Excel Statistical Function that calculates the chi-square distribution of the two datasets of two variables.


what is the CHISQ.TEST Function in Excel?
The CHISQ.TEST Function is an Excel Statistical Function that calculates the chi-square distribution of the two datasets of two variables. The CHISQ.TEST function helps in understanding if there is any relationship between the given observations and expected frequencies.
The function calculates the Chi-square distribution using the formula. A low chi-square result indicates independence between the variables under observation.
Under the premise of independence, the function returns the likelihood that a chi-square statistic value as high as the computed value could have happened by chance.
This function helps to understand whether the differences between the datasets are due to some sampling error or other factors.
Statistically, the chi-square distribution is the squared sum of independent standard normal random variables.
If k is the number of degrees of freedom of the distribution, it would have k square terms. It helps in inferential statistics, hypothesis testing, and constructing confidence intervals for statistical analysis.
The following formula gives the chi-square distribution:

Here:
- Aij refers to the actual/observed frequency in the i’th row and j’th column
- Eij refers to the expected frequency in the i’th row and j’th column
- r refers to the number of rows
- c refers to the total number of columns
The chi-square test indicates whether the value of the chi-square distribution for independent data sets is likely to happen by chance only. The formula for the CHISQ.TEST function is:
=CHISQ.TEST(actual_range, expected_range)
The terms in parentheses are called the arguments of the function. These are the values the function requires to perform the computations and produce the desired result. The arguments required by the CHISQ.TEST function are:
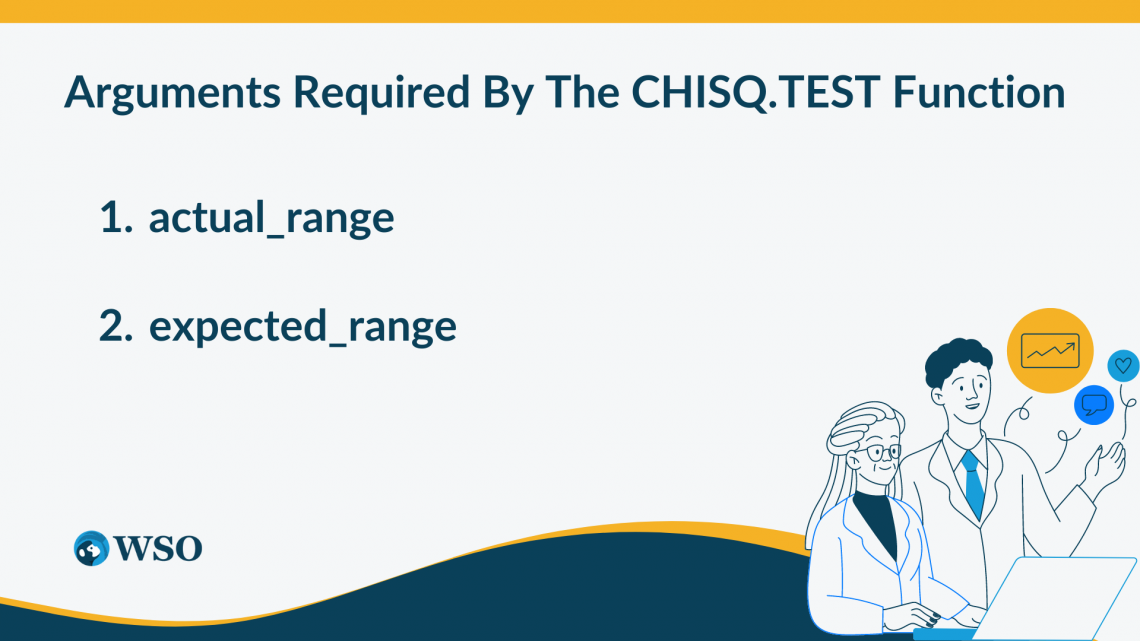
- actual_range: This argument refers to the range of data containing observations to be tested against the expected values. In other words, it is an array of the observed frequencies.
- expected_range: This argument refers to the range of data containing the ratio of the product of the sum of rows and the sum of columns to the total of the entire dataset. In other words, it is an array of the expected frequencies.
The actual_range and the expected_range must have the same dimensions.
With Excel, data analysts can utilize charting and graphing capabilities to interpret data visually and intuitively. It also provides many functions and features to perform complex mathematical, statistical, and arithmetic operations on data, yielding valuable insights and conclusions.
By automating mathematical calculations, Excel helps save time as we no longer have to perform them manually. This efficiency makes it a highly efficient and time-saving software for companies to store, analyze, and structure their data.
We have seen different types of functions and their use cases in Excel: financial functions, statistical functions, auditing functions, and arithmetic functions. These functions help in different scenarios based on the user’s requirements.
In this article, we will focus on the CHISQ.TEST function, which is a statistical function. Statistical functions are used in Excel to deal with probability distributions and their statistical implications.
- The CHISQ.TEST function is one of Excel's statistical functions that calculates the two datasets' chi-square distribution, especially the observed and expected frequencies.
- The CHISQ.TEST function performs the chi-square test to determine how likely it is that an observed distribution is due to chance by comparing the observed frequencies with the expected frequencies.
- The CHISQ.TEST function returns the p-value associated with a chi-square distribution. The p-value indicates the probability of observing the calculated chi-square statistic (or a more extreme value) if the null hypothesis is true.
- The CHISQ.TEST function may return errors if the data provided is not numeric or if the arrays obs_array and exp_array have different dimensions. In such cases, it may return a #VALUE! error.
Examples of the CHISQ.TEST Function in Excel
Having examined the theoretical definition of the CHISQ.TEST function, let us now examine an example to understand its practical applications and usage in the industry.

Suppose we have two students, John and Sam, who perform a statistical experiment on a chi-square distribution with three independent datasets. The observed/actual frequencies they got and the expected frequencies are shown in the Excel worksheet below:
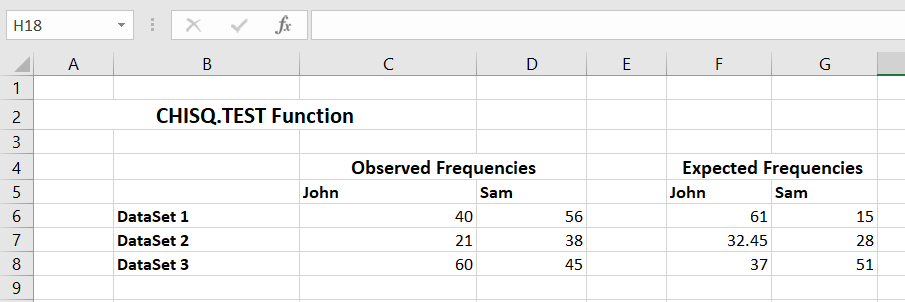
To calculate the chi-square test for verifying the independence of the above datasets using in Excel, we use the following formula:
=CHISQ.TEST(C6:D8, F6:G8)
On using the above formula in cell C10 of our Excel worksheet, we get the following result:

A low value of the chi-squared test indicates a greater level of independence. A number of 0.05 or less typically denotes a significant difference between actual and predicted frequencies that is not the result of sampling error.
In the above example, the value obtained is sufficiently less than 0.05. So the observed and expected frequencies differ significantly, and this difference is unlikely due to any sampling error. There must be some other cause responsible for the difference.
Types of Errors in the CHISQ.TEST Function
The commonly encountered errors while using it in Excel are as follows:
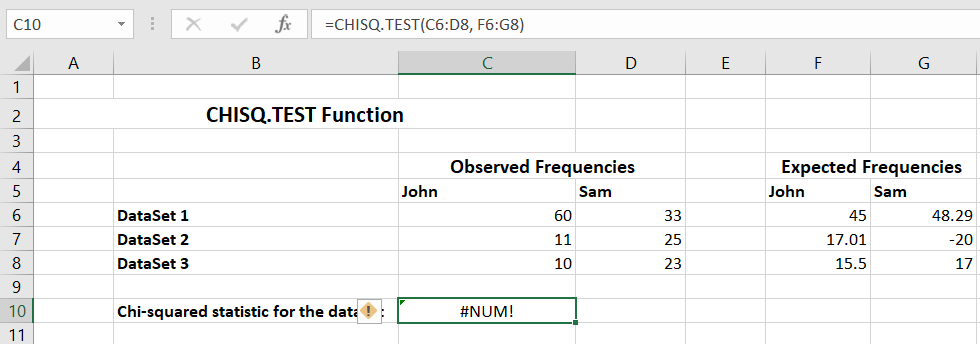
1. #NUM! Error
When any value in the expected range is negative, the function returns #NUM! Error. The CHISQ.TEST function cannot handle negative values, so ensure all values in the expected range are positive.
2. #N/A Error
The function shows this error in two cases:
- If the data arrays for the observed and expected ranges are of different dimensions.
- If the data arrays for the observed and expected ranges contain only 1 value, implying the length and width are equal to 1.
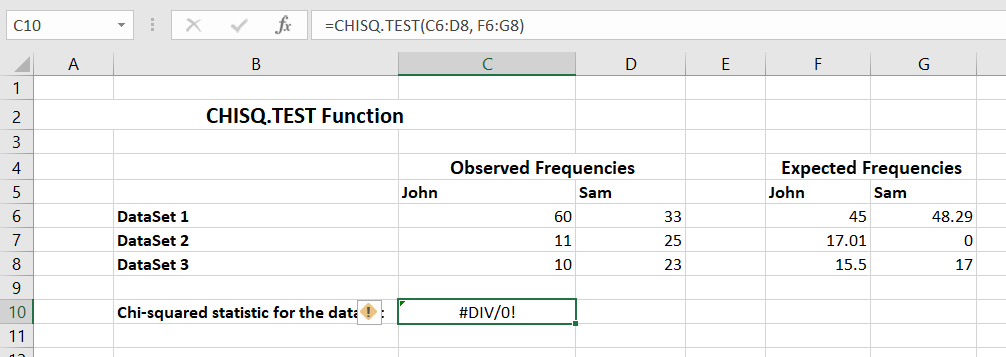
3. #DIV/0! Error
When any of the values in the data array for the expected range is 0, the function returns #DIV/0! Error.
In this way, we can use it in Excel to calculate the value of the chi-squared test and hence analyze the independence of the observed and expected frequencies.
If a small number is obtained in this test(less than 0.05), it indicates significant discrepancies between the observed and expected frequencies, which is not likely due to sampling error.

Free Resources
To continue learning and advancing your career, check out these additional helpful WSO resources:


or Want to Sign up with your social account?