NORM.S.DIST Function
Statistical feature in Excel that calculates a given value's standard normal distribution function


What Is NORM.S.DIST Function?
The NORM.S.DIST function is a statistical feature in Excel that calculates a given value's standard normal distribution function. It determines the probability of a random value less than 0.5 and is normally distributed.
The NORM.S.DIST function in Excel returns the output for cumulative and probability distributions through z-score. When we have a z-score, we can find the distributed integer for that variable.
This tool is useful for financial analysts who want to find whether the probability is less than or equal to a specified value in a standard normal distribution. It is also used to determine changes in stock prices and price indexes.
- NORM.S.DIST in Excel calculates the standard normal distribution function for a given value, determining the probability of a random value less than or equal to the specified value in a standard normal distribution.
- The syntax is =NORM.S.DIST(z, cumulative), where z is the value to be distributed, and cumulative is a logical argument indicating whether to use the cumulative distribution function (TRUE) or the probability distribution function (FALSE).
- Input the desired z value and specify whether to find the cumulative or probability distribution. Use TRUE for cumulative distribution and FALSE for probability distribution.
NORM.S.DIST Function Formula
The syntax for this function in Excel is
=NORM.S.DIST(z,cumulative)
where
- z (required): value that is needed to be distributed
- cumulative (required): a logical argument that shows us what distribution is returned
- TRUE = uses the cumulative distribution function
- FALSE = uses the probability distribution function
Note
CDF measures both continuous and discontinuous variables, while PDF measures the probability distribution of a continuous random variable.
How to use the Standard Normal Distribution Function in Excel?
The Standard Normal Distribution function in Excel is very simple to use. First, you will need a z-value to use it. Then, you will want to insert it into the formula and put TRUE or FALSE. We will review how this formula operates through the step-by-step guide below.
1. Step 1: Input the z value
You must input a value you want to distribute to use the Standard Normal Distribution function.
2. Step 2: Put a TRUE or FALSE argument
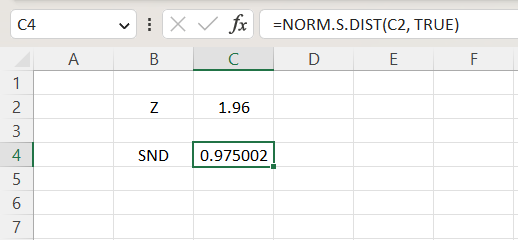
Let’s say we have 1.96 as our value and want the cumulative distribution. So we put 1.96 for z and TRUE to find the cumulative.
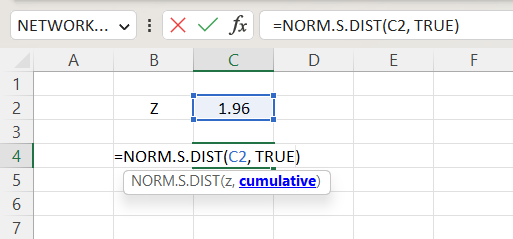
3. Step 3: Hit the enter key
Once we have inputted our arguments into the syntax, we hit the enter key and return approximately 0.975002 as our answer.
NORM.S.DIST Function Example
We will go over this function in greater detail by providing more examples. Below is a screenshot using the cumulative standard normal distribution.
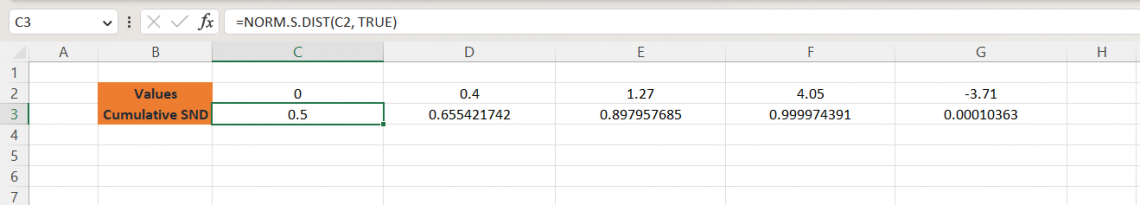
Suppose we have five values listed (0, 0.4, 1.27, 6.11, -3.71), and we want to find the cumulative standard normal distribution for each of those integers. We input the values into the parentheses and get
- 0.5 as the cumulative SND for 0
- Approx. 0.655 as the cumulative SND for 0.4
- Approx. 0.898 as the cumulative SND for 1.27
- Approx. 1 as the cumulative SND for 6.11
- Approx. 0 as the cumulative SND for -3.71
You want to determine those five numbers’ probability standard normal distribution. What you’ll do here is change the cumulative from TRUE to FALSE to find the probability.
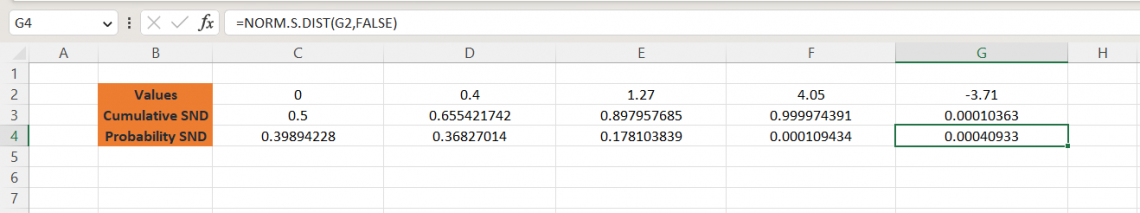
As you can see from my screenshot above, the answers for the probability are different from the cumulative ones. We got:
- Approx 0.399 as the probability SND for 0
- Approx 0.368 as the probability SND for 0.4
- Approx 0.178 as the probability SND for 1.27
- Approx 0 as the probability SND for 4.05
- Approx 0 as the probability SND for -3.71
Standard Normal Distribution vs. Normal Distribution
Now that we understand how Standard Normal Distribution works, you’re probably wondering what Normal Distribution is and how it differs from SND.
Normal Distribution is an Excel function that calculates the probability of whether variable x is below or at the specified value. It calculates either the normal probability density or the cumulative normal distribution function.
The syntax for Normal Distribution is
=NORM.DIST(x, mean, standard_dev, cumulative)
where
- x (required): The value that you want to distribute
- mean (required): The arithmetic mean of the distribution
- standard_dev (required): Standard deviation within that distribution
- cumulative (required): Logical TRUE or FALSE statement
- TRUE = Cumulative Normal Distribution Function
- FALSE = Probability Normal Distribution Function
Note
NORM.S.DIST refers to a unit normal distribution, whereas NORMDIST refers to any normal distribution.
Example
Suppose we have the x, mean, and standard deviation values given to us. Next, we want to determine what the cumulative normal distribution is for each of those values.
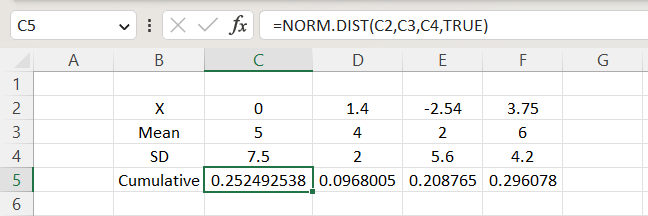
- First, we want to distribute x = 0. We have a mean of 5, and our SD is 7.5. We input =NORM.DIST(C2, C3, C4, TRUE) in cell C5, and we return approximately 0.252 as our answer
- Next, we want to distribute 1.4. We have a mean of 4, and our SD is 2. Using the same method to solve the last problem, we get approximately 0.0968 as our answer
- Then, we want to distribute a negative integer, which in this case is -2.54. Our mean is 2, and we have 5.6 as our SD. We get approximately 0.2088
- Finally, we want to distribute 3.75. Our mean is 6, and our SD is 4.2. So our answer is approximately 0.2961
Now that we have solved the cumulative ND, we want to find out our answers if we did the probability ND.
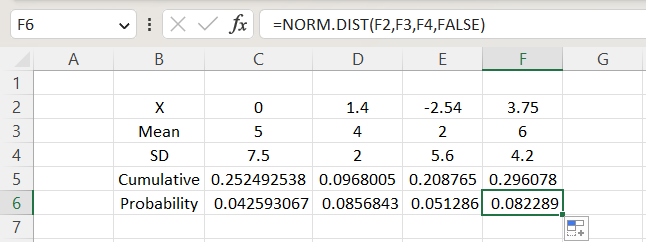
As you can see from my screenshot, the answers for the cumulative and probability normal distributions are different. The only change is the logical statement from TRUE to FALSE. We get
- Approx 0.0426 as our probability for 0
- Approx 0.0857 as our probability for 1.4
- Approx 0.0513 as our probability for -2.54
- Approx 0.0823 as our probability for 3.75

Free Resources
To continue learning and advancing your career, check out these additional helpful WSO resources:


or Want to Sign up with your social account?