NORM.INV Function
A tool in Excel to help users determine the inverse of the normal cumulative function.


What is the NORMINV Function?
The NORMINV Function (normal inverse function) is a tool in Excel to help users determine the inverse of the normal cumulative function. The normal cumulative function can be found using the normal distribution function, a similar Excel tool.
The normal distribution function can be used to determine the probability of a data point being in a specific area, using parameters of the z-score of the bounds of that particular area, the mean, and the standard deviation.
The normal inverse function is precisely what it sounds like, as it uses the probability of a data point being in a particular area, the mean, and the standard deviation to determine the bound.
In other words, normal distribution and inverse functions use the mean and standard deviation. Still, they each require a third argument inputted, which is what the opposite function outputs.
In finance, the standard distribution curve is important as it helps investors understand if a stock is undervalued or overvalued, as stock prices are normally distributed. Additionally, forex rates and price indices are assumed to be normally distributed.
- Excel’s NORM.INV is a tool to determine the x value in a normal cumulative function using the probability of a range of values (bounded by the x value) occurring, the mean, and the standard deviation.
- INV.NORM can only be used for normal distributions
- The formula is =NORM.INV(probability,mean,standard_dev)
- probability: the probability of a value falling at the x value or lower
- mean: population average
- standard_dev: population standard deviation
- Typically, the mean and standard deviation for the population is known, but if not, they can be calculated for the sample:
- Mean: =AVERAGE(number1:number2)
- Standard Deviation: =STDEV(number1:number2)
- Where number 1 and number 2 are the names of cells that enclose a range of cells or are the exact cell names.
Statistics Behind the NORMINV Function
The normal inverse function can only be used for normal distributions, a particular symmetrical bell curve. The curve can be divided into sections measured by their distances from the mean, and these distances are measured in standard deviations.
This can be seen in the graph below, depicting a normal distribution.
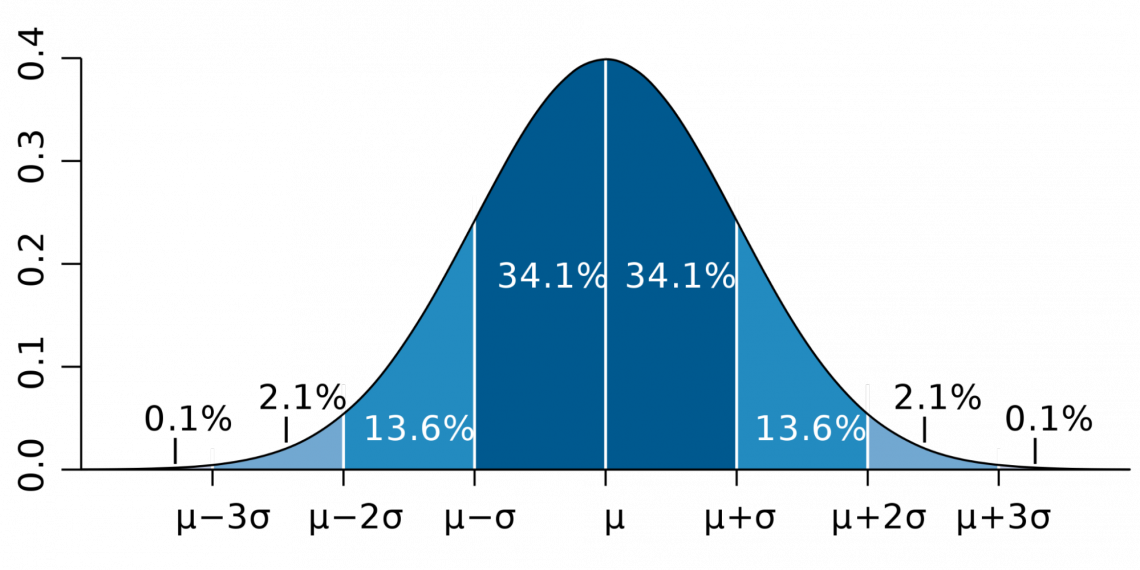
The area between 1 standard deviation above and below the mean is approximately 68% of the total distribution. The area that falls between 2 standard deviations above and below the mean is around 95% of the distribution, and between 3 standard deviations is 99.7%.
NOTE
The number of standard deviations apart can measure the distance between the mean and a value. This is known as the z-score.
Knowing the z-score can be helpful as there are z-score tables that can provide more information about a distribution based on the z-score. The z-score can be calculated using the following formula:
Z = (x - µ)/ σ
Where
- μ is the population mean
- σ is the population standard deviation
- x is the data point that the normal inverse function finds
Additionally, it is essential to note that the area under the standard distribution curve will not be 100% of the distribution because of outliers.
Outliers are values significantly far from the data clustered around the mean, and outliers are expected to exist. Standard distribution graphs are for the population, so the chance that there are a few outliers is high enough.
The expected inverse function is complex to do by hand, but it is essential to learn to help you better understand the formula in Excel.
Let's assume that we already have the mean (μ), standard deviation (σ), and probability (P). These are the typical givens, but in some instances, you will have to calculate the mean and standard deviation independently.
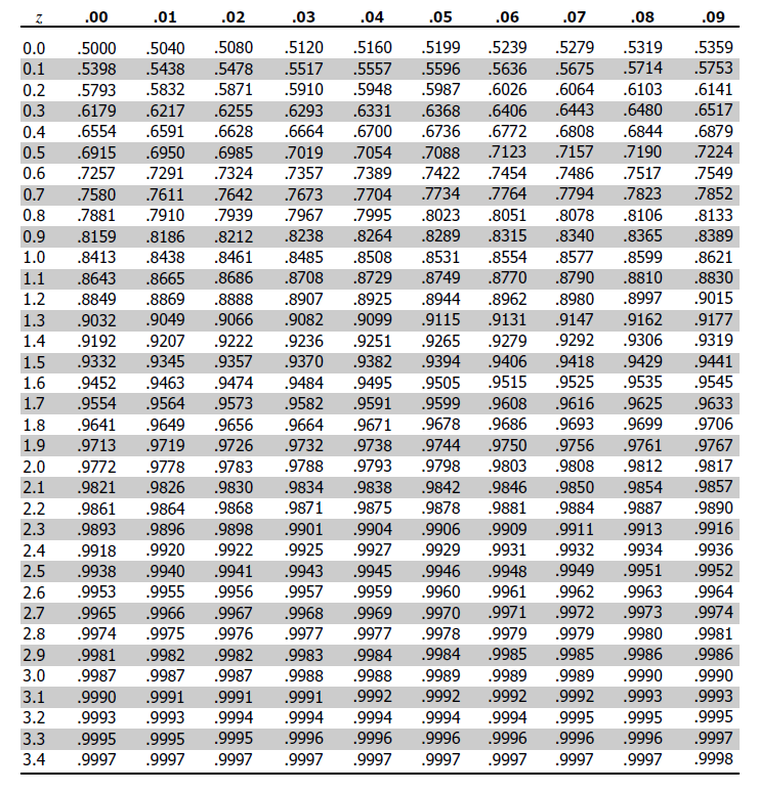
We will have to look up the P value in a z-table, a standardized table that allows us to find more information about our distribution. The table is set up where the z-scores are the axes, and the information within the table is the P.
Using the z-score formula, we can solve for x, which will be our final answer:
Z = (x - µ)/ σ
x = (Z * σ) + µ
How to Use Excel NORM.INV Function
The expected inverse function in Excel is quite helpful, as it speeds up a potentially tedious task.
The NORM.INV function is denoted below:
=NORM.INV(probability,mean,standard_dev)
Where:
- Probability (required) is the probability given by the normal distribution.
- This must be entered as a decimal between 0 and 1, or the error #NUM! is displayed.
- Mean (required) is the average of the distribution.
- standard_dev (required) is the standard deviation of the distribution.
NOTE
Statistically speaking, the mean of the population (μ) and the population's standard deviation (σ) will be used for mean and standard_dev to ensure higher accuracy.
However, in some cases, the population parameters are not given, and the sample mean (x̄) and sample standard deviation (s) will be used instead.
While using sample parameters is partially correct, it is less accurate because the population has details on all the data points in the set. In contrast, the sample only has a few randomly selected.
So, it may be useful to understand how to calculate mean and standard deviation in Excel. The mean can be calculated using
=AVERAGE(number1:number2),
and the standard deviation can be calculated using
=STDEV(number1:number2)
In both formulas, the arguments are either the exact cell names that contain each data point or cell names that include a range of cells for which the calculation is for.
Example of NORMINV Distribution
Let's solve an example by hand and using the Excel function.
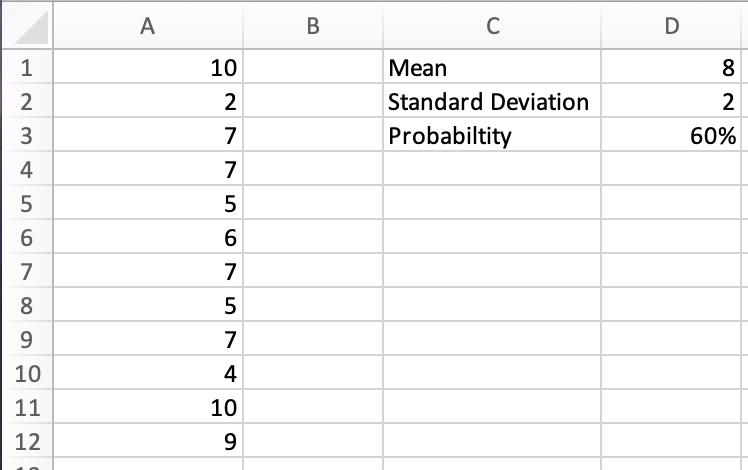
Say we are looking at a sample of shoe sizes for 12 randomly selected women, with a population means of 6.5 and a population standard deviation of 2. The shoe size for all women is usually distributed. The data is as follows:
10, 2, 7, 7, 5, 6, 7, 5, 7, 4, 10, 9
We are trying to find the shoe size that corresponds with the cumulative distribution probability of 60%. Because this does not correspond exactly with a z-score we can see on a regular distribution graph, we need to do a few calculations.
First, we need to find the z-score that corresponds to 60%.
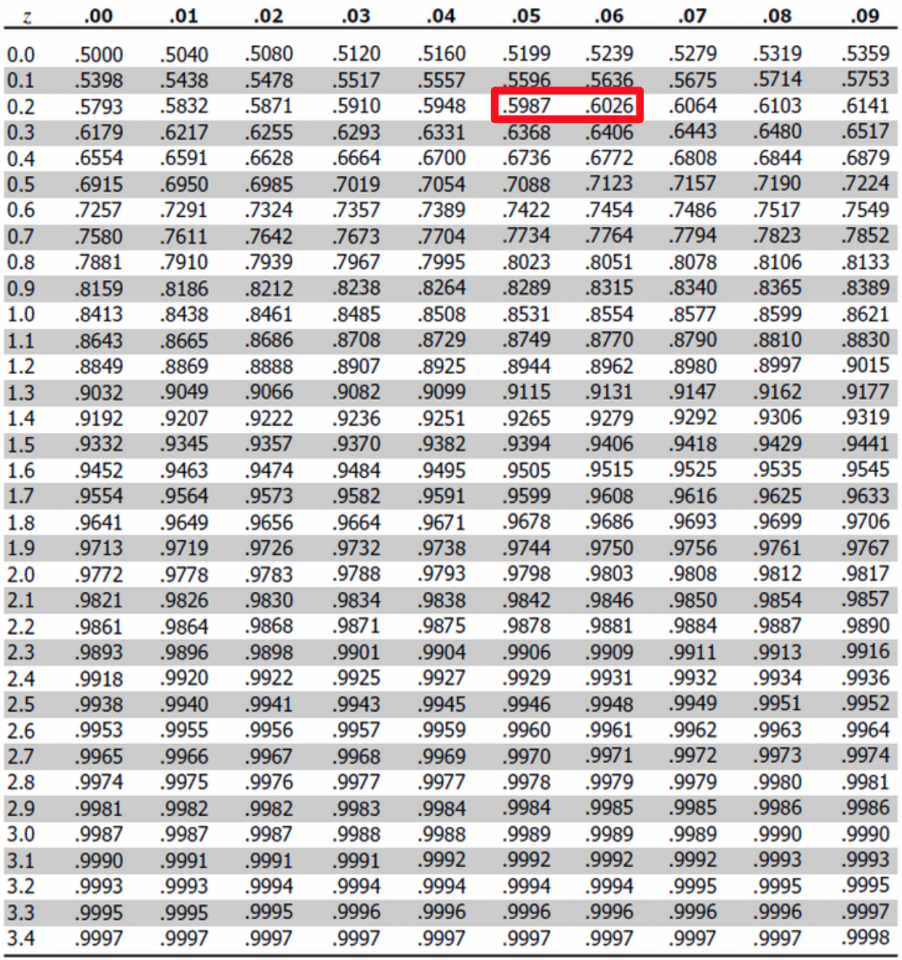
On the table, this corresponds to a spot between. .25 and .26. We will round down and use .25 as the z-score as it is closer to 60%. Now, we can solve for x:
Z = (x - µ)/ σ
x = (Z * σ) + µ
x = (0.25 * 2) + 6
x = 6.5
So, we can conclude that the x value that corresponds with a 60% cumulative distribution probability is the shoe size 6.5
Now, we can solve the same problem using Excel. First, we must input the data and other information into a spreadsheet.
Now, we can use the NORM.INV function to find our x value:
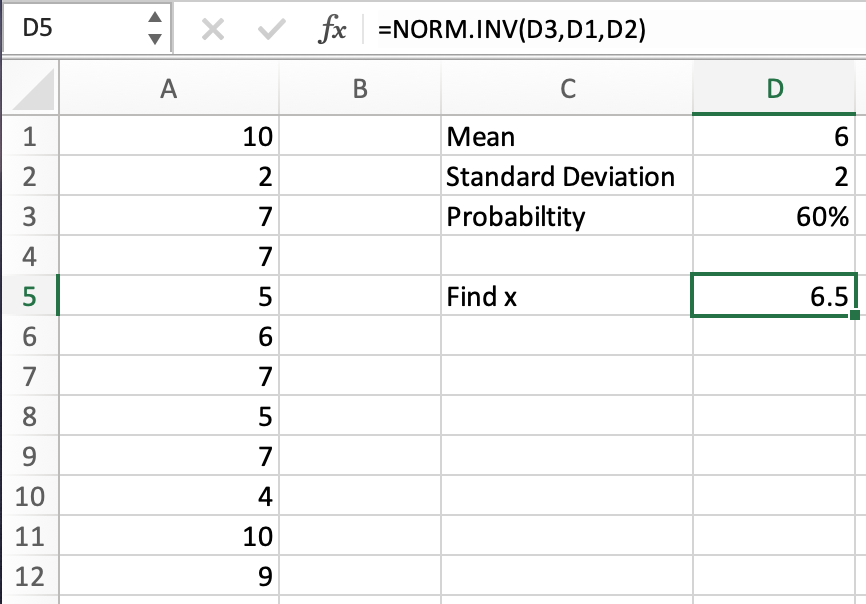
Here, by using the NORM.INV function, we calculated that the women’s shoe size that is in the 60th percentile is 6.5.


or Want to Sign up with your social account?