FORECAST.LINEAR Function
Function in Excel that utilizes linear regression to forecast a future point based on known x and y values


What is the FORECAST.LINEAR Function?
The FORECAST.LINEAR function in Excel utilizes linear regression to forecast a future point based on known x and y values. If your function returns an inaccurate result, consider whether or not your dataset is a linear or non-linear line regression.
Non-linear regression data is not suitable for the FORECAST.LINEAR function, which is designed specifically for linear regression. If you want to calculate the data of a non-linear line regression, use a more compatible function like NLSOLVE.
To ensure an accurate forecasted point, consider the linear line regression of the given dataset.
You may have a linear line and are looking for the forecasted point; try another similar Excel function for a more accurate result.
The FORECAST.LINEAR function is optimized for linear forecasts. For more precise forecasting with additional factors, consider using other functions such as FORECAST.ETS or FORECAST.ETS.CONFINT.
- The FORECAST.LINEAR function in Excel predicts future points based on known x and y values using linear regression, aiding decision-making and alignment of stakeholders.
- It's designed for linear regression and may not yield accurate results for non-linear data. If used, ensure the dataset conforms to linear regression.
- It also provides strategic focus, inspires collaboration, and shapes a company's image, often requiring significant investment in development.
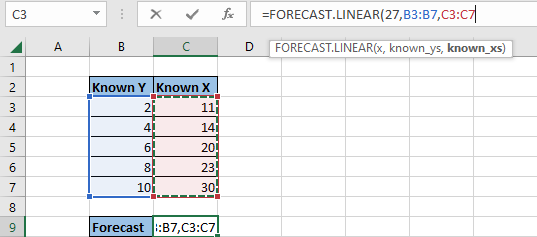
- The formula is FORECAST.LINEAR(x, known_y's, known_x's), where 'x' represents the value to forecast, 'known_y's' are known y-values, and 'known_x's' are corresponding known x-values.
FORECAST.LINEAR Function Formula
The formula needed to determine the forecasted point of a linear line function is as follows:
FORECAST.LINEAR(x, known_y’s, known_x’s)
Let's delve into its components to understand how to find a function's X and Y values using the FORECAST.LINEAR function.
When searching for the value of a given function, the FORECAST.LINEAR function provides the tools for that. The 'x' component represents the value for which you want to forecast the corresponding 'y' value.
As you may know, the “x” is considered the x-value of the line function. This is used to find the forecasted point of the y-value.
Moving on to the other side of the distribution is the y-value. The formula requires that all data sets containing the “known_y’s” be entered following the x-value you are looking for.
The known 'y' values correspond to the known 'x' values used to build the linear regression model.
Now, back to the x-values of the distribution, a list of “known_x’s” is necessary to calculate the entire data set. Similarly to the 'known_y’s' component, the 'known_x’s' represents the known 'x' values corresponding to the 'known_y’s' used to build the linear regression model.
After going through each formula component, you may notice that all numerical datasets of the X and Y components are the foundations of calculating a linear line function.
How to use the FORECAST.LINEAR Function in Excel?
In the example depicted, the categories “known_y’s” and “known_x’s” have inputted data to calculate the forecasted point of twenty-seven.
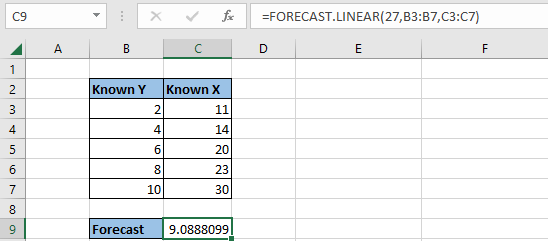
The reason for searching for the x-value of twenty-seven is to predict the corresponding y-value or 'known_y's' based on the linear relationship between the known data points. Twenty-seven also falls between the “known_x’s” data set, which lies after twenty-three and before thirty.
The function may return an error if you input an x-value that does not align with the provided dataset.
Note
To avoid encountering an error or inaccurate result, double-check that your values are inputted correctly or that the value you seek is aligned.
After organizing the data, as shown in the example, you can proceed to calculate the forecasted value using the FORECAST.LINEAR function. To begin, you may locate the FORECAST.LINEAR function in different ways.
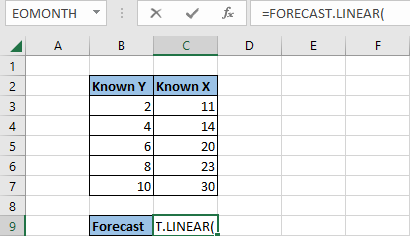
To use the FORECAST.LINEAR function, click on the cell where you want the forecasted value to appear, then type '=FORECAST.LINEAR(' and continue with the remaining steps.
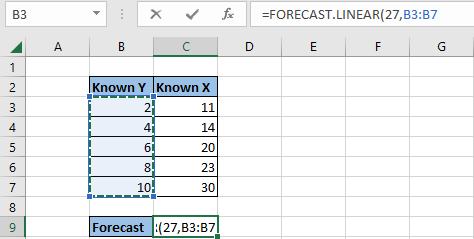
From here, you will manually input any numerical value that falls along the numerical set within the “x” component. In this example, twenty-seven aligns with the numerical set in the category “Known X.”
Next, the “x” component is followed by a comma with data highlighting in the column “Known Y.”
After the “known_y’s” are recorded in the function, set another comma and highlight cells in column “Known X” to complete the required components of the function.
As highlighted in cell C9, the forecasted point of the linear line function is computed to determine the linear point of “x,” which in this example is 27. Additionally, by taking the Known Y and Known X values, the forecasted return is 9.0888099.
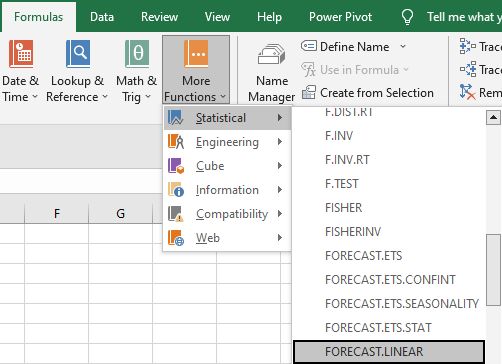
Another way to locate the FORECAST.LINEAR function is to follow the steps as directed in the instructions:
- In the Excel sheet, locate the Formulas tab at the top bar
- Click on More Functions
- In the drop-down bar, you will see six additional categories. Click on Statistics
- Another drop-down bar will appear with functions in alphabetical order. Scroll down and locate “FORECAST.LINEAR”
If you receive an error of #NUM! or #VALUE!, then the following inputs may be inputted incorrectly:
- The values of the function are non-numerical
- The “known_y’s” or “known_x’s” column does not have any value inputted
- Zero is inputted in the “known_x’s” column
Remember that all values inputted for “known_y’s” and “known_x’s” must be of a numerical set greater than zero.

Free Resources
To continue learning and advancing your career, check out these additional helpful WSO resources:


or Want to Sign up with your social account?