SLOPE Function
An Excel Statistical Function that calculates the slope of a linear regression line through a given data set.


What is the SLOPE Function?
The SLOPE function is an Excel Statistical Function that calculates the slope of a linear regression line through a given data set.
Let’s say you have two sets of data, and you would like to understand or assess whether there is a relationship between them. You can find that relationship by performing a linear regression and calculating its slope.
Slope, as a concept, is utilized in economics, engineering, architecture, and mathematics.
The slope of a line is a number that measures a line’s direction as well as steepness. It is denoted by the letter m in mathematics. The formula for m is given below:
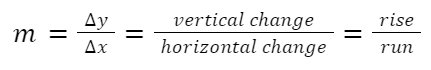
From the formula, we understand that m is a ratio of the vertical change to the horizontal change between any two distinct points on the line.
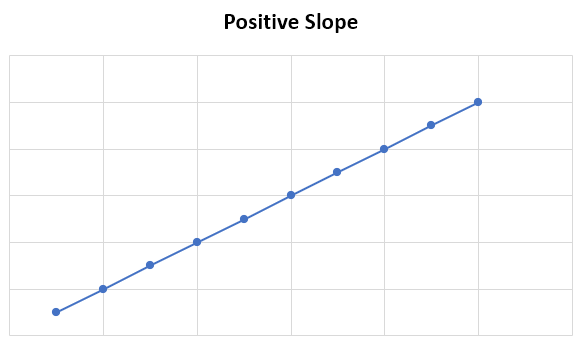
Under certain circumstances, the slope can be positive, negative, zero, or undefined. When a line goes upwards from left to right, that is described as a positive slope. A positive slope is expressed as m greater than 0.
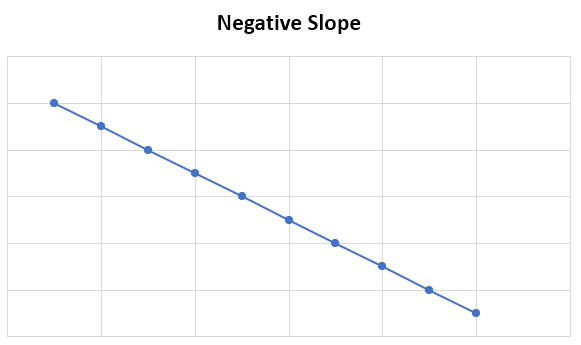
The slope is considered to be negative when the line is going downward from left to right. A negative slope is expressed as m being less than 0.
The line can be horizontal as well, and the slope is considered to be zero. But when the line is completely vertical, then the slope is undefined or unclear.
The slope is a useful concept in economics as well, as it can be used to understand the relationship between two commodities or the relationship between two currencies. It's also commonly used in a product's demand and supply curves or perhaps for a particular market.
For example, let’s say that we want to understand the relationship between the price of petrol and the sale of cars. Using slope, we can determine whether the sale of cars moves along with the price of petrol or whether they move in opposite directions.
The same can be done to assess whether the US Dollar moves with or against the Great British Pound.
All in all, the slope has many uses, and in this article, we aim to utilize the concept in trying to figure out the relationship between the market and a particular stock. This is done by calculating beta, which will be explained shortly.
- The SLOPE function is a Statistical function in Excel that is used to calculate the slope of the linear regression line that best fits a given set of data points.
- Users provide two arrays of data points - one for the independent variable (x-values) and one for the dependent variable (y-values). The function returns the slope of the regression line.
- Potential errors that users might encounter when using the SLOPE function, such as providing non-numeric values or referencing cells with incorrect data, and how to address them effectively.
- SLOPE function finds applications in finance, economics, and other fields where analyzing trends and relationships between variables is important for decision-making, risk management, and forecasting.
How to use the SLOPE Function in Excel?
The syntax for the Slope function in excel is:
=SLOPE(known_y's, known_X's)

The slope function uses the following arguments:
- Known_y’s – This is a required argument for the formula to work. This can be an array or cell range of numeric dependent data points.
- Known_x’s – This is the second argument that is also required. The second argument is used as a set of independent data points as opposed to dependent ones.
There are a few things to consider while using this function, and they are as follows:
- You can only use numbers, names, arrays, or references containing numbers as arguments.
- Even if the cells contain a value of zero in the array or in the argument, it's still included in the slope calculation.
- If the known_y's and known_x's data points are mismatched in number, then the SLOPE function will return the #N/A error value.
- The equation for the slope of the regression line is:

What is Beta?
The SLOPE function can be used to calculate the beta of the stock, but what exactly is beta?
The volatility of a stock in relation to the market is measured by its beta. It seeks to understand how a stock’s price fluctuates in response to the movement of the market.
A beta of 1 signifies that the company's price moves in the same direction as the market. If the beta is below 1, that means that the stock is less volatile than the market. If the beta is over 1, that is an indication that the stock is more volatile than the market.
Beta is a key metric in finance, notably in risk analysis and portfolio management. Using this feature of beta, we can use it to calculate the expected return of any stock. Using the beta to calculate expected return is most commonly known as the Capital Asset Pricing Model (CAPM).
Note
The Capital Asset Pricing Model is used to describe the relationship between the expected return and the risk of investing in a security. In the CAPM model,
Expected return = Risk-Free Rate + Beta (Equity Risk Premium – Risk-Free Rate).
With beta, investors can decide which stocks to buy and how to balance their portfolios to attain the degree of risk and return they want.
The formula for beta is equal to the covariance divided by variance. The covariance is the measure of a stock’s return relative to the market's. The variance here is the measure of how the market moves relative to its mean.
Beta = Covariance / Variance
- Covariance here measures how the stock and the market move together.
- A positive covariance means the stock and the market move together when their prices increase or decrease.
- A negative covariance means the stock and the market move in opposite directions.
- Covariance is not limited to just measuring the relationship between a stock and an index. It can also be used to measure the relationship between two stocks or perhaps two indexes.
- Variance refers to how far the market moves in relation to its mean. It does not have to be the market. It can also be an individual stock.
Calculating Beta In Excel Using The SLOPE Function
Before we calculate the beta of a stock using the Excel function, we'll need to gather the necessary data. This includes the historical prices of the stock you’re looking at and the market's historical performance.
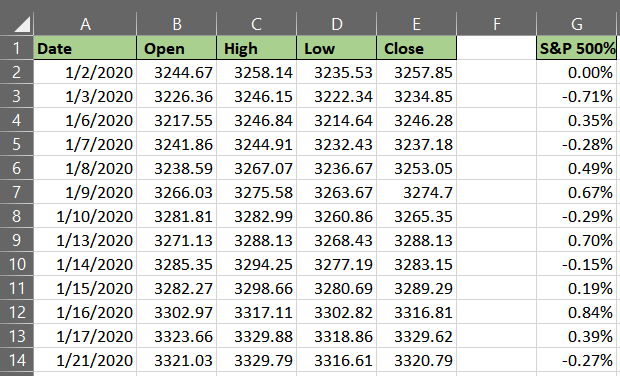
There are many market indexes you can choose from to base your calculation on, such as the Russell 2000, S&P 500, NASDAQ, Dow Jones Industrial Average, and more. In this example, we’ve taken the S&P 500 as it is a good representative of the overall market.
You can download the historical prices of stocks and indexes for free from many websites. Yahoo! and the Wall Street Journal can be used, for example.
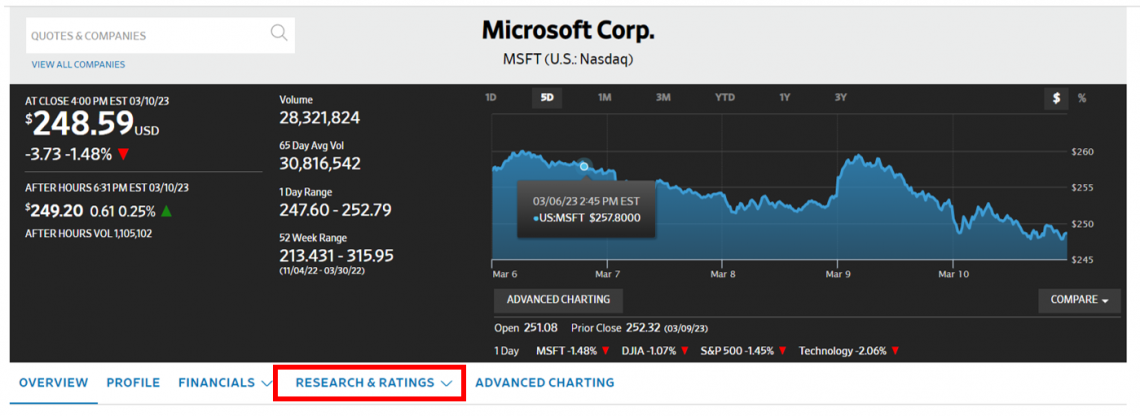
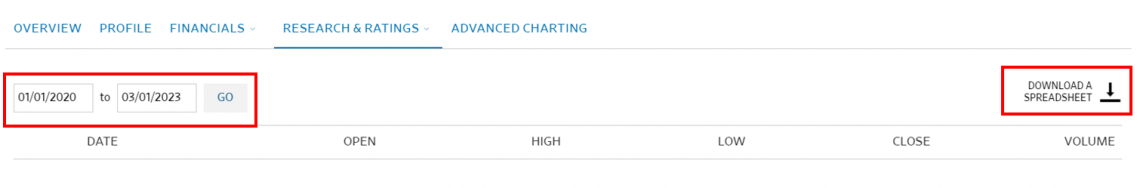
Select the dates or time periods you want for the stock and the index. When you're done specifying, you can go ahead and download the excel spreadsheet, and it will look like the following.
In this example, we have taken Microsoft as our stock, for which we will be calculating the beta.
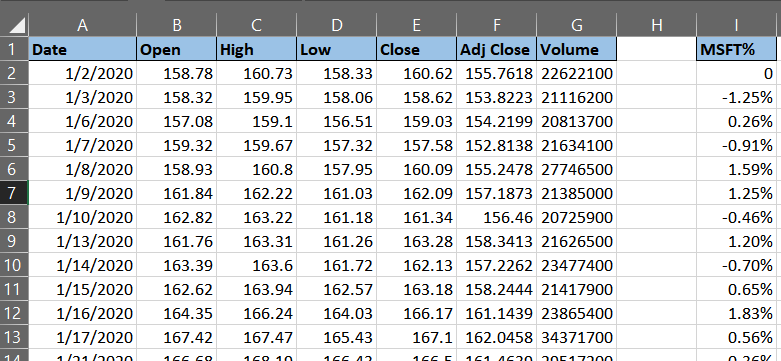
Please note that we have taken more than three years of data, which amounts to 794 trading days. Lucky for us, all the calculations are automated once you put in the appropriate formula.
Before we calculate beta, we must first calculate the daily percentage return for Microsoft (MSFT) and the S&P 500, as shown above.
To calculate the percentage return, all you need to do is use the following formula:
=(St - So) / So
- St here is the new price
- So here is the old price
For example, the percentage return for Microsoft on 1/3/2020, that is 3rd of January, 2020
= (158.62 - 160.62) / 160.62 = -0.01245 or -1.245%
For the S&P 500, the percentage return on the 1/3/2020, that is 3rd of January, 2020
= (3,234.85 - 3,257.85) / 3,257.85 = -0.00706 or -0.706%
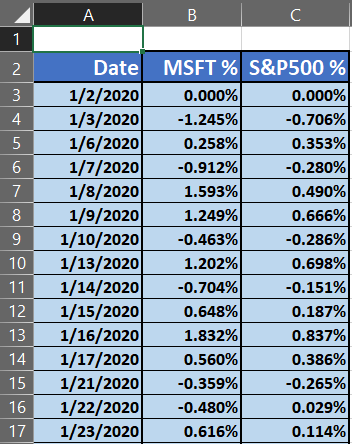
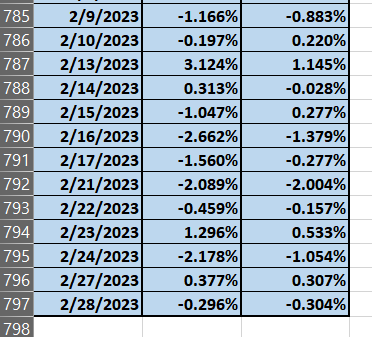
You can copy the formula for all the cells, and you will have all the necessary figures required to calculate the beta. The beta can be calculated in two ways:
- Using the SLOPE function
- Using the COVARIANCE and VARIANCE function
With the slope function, the first input would be all the percentage returns for Microsoft (MSFT), and you can do this by using an array which will make the whole process easier and faster.
The second argument would be all the percentage returns for the S&P 500 index, which you can also an array for, as shown below:

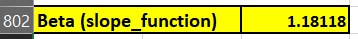
Using the covariance and the variance function, we would need to divide the covariance by the variance. In using the covariance function, the first argument would be the percentage returns of the S&P 500, and the second argument would be the percentage returns of Microsoft (MSFT).
As mentioned earlier, you can use arrays here for the covariance and the variance function to make it convenient.
The variance function would take the percentage returns of the S&P 500 only. We have used COVARIANCE.P and VAR.P as both functions are used for a population.
Note
If you only have a sample, using the COVARIANCE.S and VAR.S would be more appropriate.

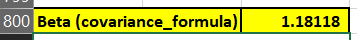
As you can conclude, no matter what method you may choose to use to calculate the beta, you will arrive at the same result.
Now, how do we interpret this beta of 1.18118? From the earlier explanation, we noted that if the beta coefficient is equal to 1, that would mean that the stock is moving in line with the market.
If the beta coefficient were less than 1, then that would mean that the return of the stock is less likely to respond to market movements.
In this case, the beta is clearly greater than 1, which indicates that Microsoft is more likely to respond to the S&P 500 index, which could also mean that the stock can be volatile.

Free Resources
To continue learning and advancing your career, check out these additional helpful WSO resources:


or Want to Sign up with your social account?