GROWTH Function
A Statistical function that calculates the predicted exponential growth using existing data.


What is the GROWTH Function?
The GROWTH Function in Excel is a Statistical function that calculates the predicted exponential growth using existing data. It returns new x-values by using already existing x and y-values.
Growth is a helpful tool in preparing annual plans and forecasting revenues for companies, and it is also beneficial for someone looking for a job in the financial field. We can use this feature to find out the predicted growth of something through trends and statistics.
Businesses use prospectuses when raising funds for new or growing projects. Prospectuses include projected cash flows based on the earnings that a project will likely earn. This function allows you to find future cash flows with ease and precision.
It is also best used for stockbrokers who want to determine the predictions of price trends for different stocks. For example, increases and decreases in share price from historical price movements can best be determined using Excel GROWTH.
They can also help determine how to perform quick regressions and trend analyses by projecting values from given data sets. You can create budgets and determine how to predict future price rises or falls based on past trend prices through GROWTH.
- The GROWTH function is an Excel that is used to predict future values based on existing data that follows an exponential growth trend.
- Users provide arguments such as the known_y's (existing data series of dependent values) and the known_x's (corresponding independent values or time periods).
- GROWTH function facilitates trend analysis by extrapolating existing data to forecast future trends, enabling users to make informed decisions and plans based on projected outcomes.
- GROWTH function is integral to financial modeling and planning, allowing users to project future financial performance, evaluate investment opportunities, and assess business growth potential.
GROWTH Function Formula
The syntax for growth is
=GROWTH(known_y’s, [known_x’s], [new_x’s], [const])
where
1. known_y’s = set of y-values presented in the relationship: y = b*m^x
Each column of known_y’s is interpreted as different if the y values are in a column.
Each row of known_y’s is a different value if they are in a row.
If known_y’s have a number less than or equal to 0, a #NUM! Error will appear.
2. known_x’s [optional] = a set of x-values in the relationship
Known_x can include one set of variables or more.
If there is only one set of variables, then known_x and known_y variables can be any range of shapes.
If there is more than one set of variables, known_y must be a vector, meaning that it has a height or width of one row or column, respectively.
It is an optional tool, but if you leave the section blank or omit it, it will assume it’s the same size as the known_ys.
3. new_x’s [optional] = new x-values where the growth returns corresponding y-values
They must include either a column or a row for each independent variable.
If known_y’s are within one column, known_x and new_x values must have the same columns as known_y variables.
If known_y’s are within a single row, known_x’s and new_x values should have the same amount of rows.
Likewise, with known_x, if both x variables (known and new) are omitted or left blank, Excel will assume they are the same size as known_y’s values.
4. const [optional] = logical TRUE or FALSE statement specifying whether constant b equals 1
If the constant is TRUE, then constant b is usually calculated.
If the constant is FALSE, b = 1, and m-values are adjusted.
If left blank, it will automatically assume TRUE.
Note
y = b * m^x represents the exponential curve where the value of y depends on the x-value, where m is the base with an exponent of x, and b represents a constant value.
Throughout this article, we will go through how to solve the growth function by using a step-by-step guide and using more examples using this function. We will also look at TREND and see how it differs from GROWTH.
How to use the GROWTH Function in Excel?
We will walk through some examples of how this feature works. Suppose a company has its revenue listed for four years (2015-2018), and we want to find the estimated amount for 2019.
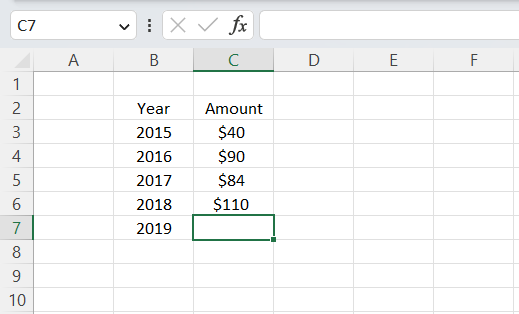
We want to insert the GROWTH syntax by inputting cells C3: C6 in the known_y's then cells B3: B6 for known_x's, and B7 for new_x. Next, we can put TRUE or blank in the constant section, as we want to calculate GROWTH normally.
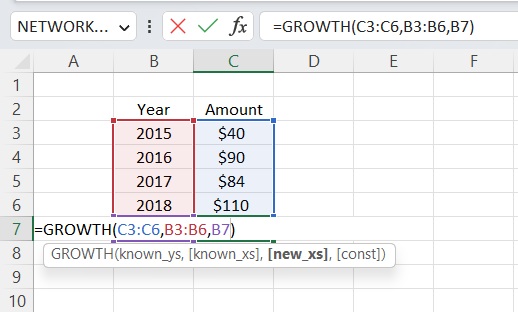
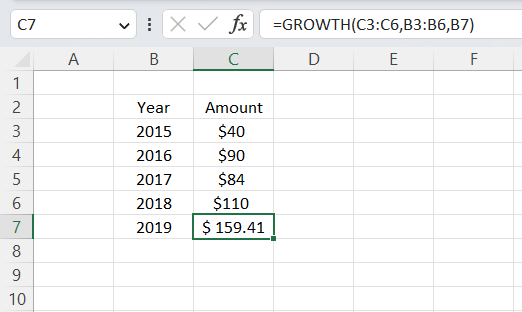
Now that we've inputted all our required arguments into the syntax, we will hit the enter key and return $159.41 as our estimated amount for 2019.
Next, we will review this function in greater detail by providing an in-depth example. Below is a screenshot of a random sample imputed where we wanted to see the growth of a company's revenue over five years. Years represent x-values, and amount represents y-values.
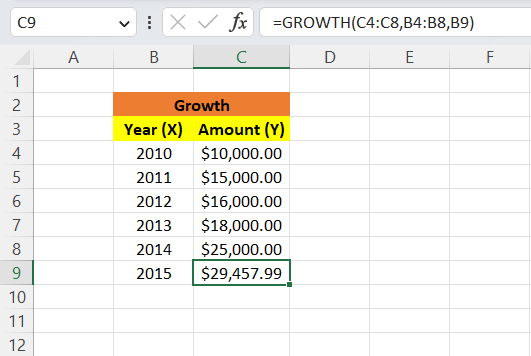
Suppose you wanted to find out the company's estimated amount in 2015. Starting with 2010, we got $10,000, $15,000 in 2011, $16,000 in 2012, $18,000 in 2013, and $25,000 in 2014. So, using the formula above, we got $29,457.99 for 2015.
In the formula, we incorporated our y-values (amount numbers). Then, we included our x-values (those being the years) and added our new x-value, which is the year 2015, and that is how we got $29,457.99 as our estimated amount in 2015.
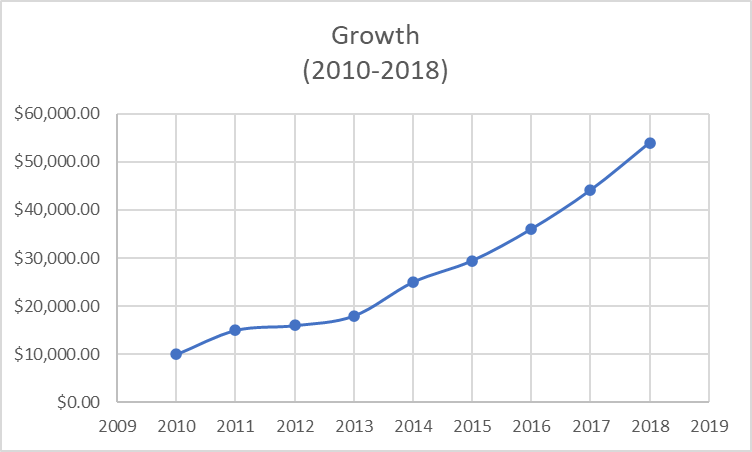
As we can conclude from this graph, the company is in a healthy place, financially speaking. The company's estimated revenue continues to keep growing at a decent pace. You may be wondering what the estimated revenue will be three years later.
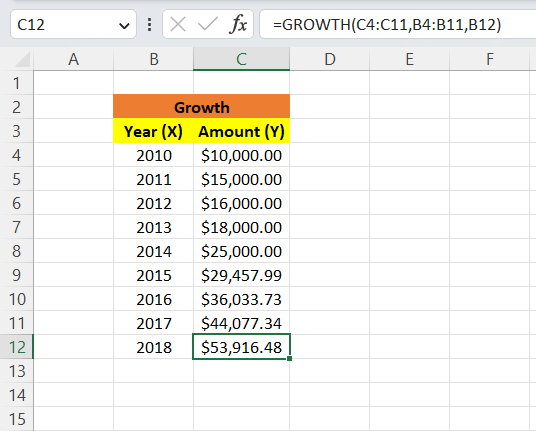
Using the same methods we used to calculate the revenue for 2015, we found that 2016's estimated revenue is $36,033.73, $44,077.34 for 2017, and $53,916.48 for 2018. As you can see above, the estimated revenue has grown more significantly than in the first five years.
Suppose you want to know how this looks from a "visual" standpoint. All you have to do is go to the insert tab, look for charts, select the range of cells you want to represent in your graph, and select the chart you want. We used a scatter chart below for reference.
GROWTH vs. TREND Function
Now that we have gotten a good idea of what the GROWTH function does, you're probably wondering if there is another way to calculate the predicted growth of something. The answer is yes; the TREND function.
TREND is an Excel function that calculates the linear trend line with arrays of known_x and known_y values. It extends the trendline to determine future y-values with new x-values. It is a helpful tool for predicting future trends.
The syntax for TREND is
=TREND(known_y’s, [known_x’s], [new_x’s], [const])
where
- known_y's = given set of y-values that are already known.
- known_x's [optional] = given set of x-values that are already known.
- new_x's [optional] = new set of x-values you use to find the new y-values.
- const [optional] = logical TRUE or FALSE statement that specifies whether constant b is equal to 1 (FALSE) or is calculated typically (TRUE).
A screenshot with the same numbers as the last example using the TREND function instead is listed below.
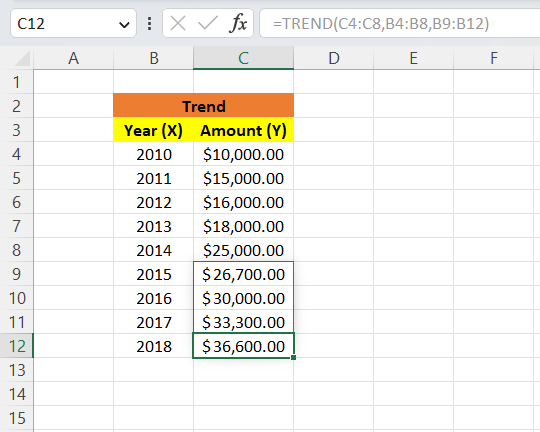
We are given the amounts for 2010-2014 and want to determine the trends for the next four years (2015-2018).
We would have to use the TREND function and input cells C4:C8 first, as those are our known y-values. Next, input B4:B8 for our known x-values. Finally, input B8:B12 for the new x-values. Then, we hit enter and get
- $26,700 for 2015.
- $30,000 for 2016.
- $33,300 for 2017.
- $36,600 for 2018.
Now that we've calculated the trends for the next four years. You want to see how it looks on a chart. Select the range of cells that you want to be referenced and choose the scatter plot in the chart tab, and it should look like this:
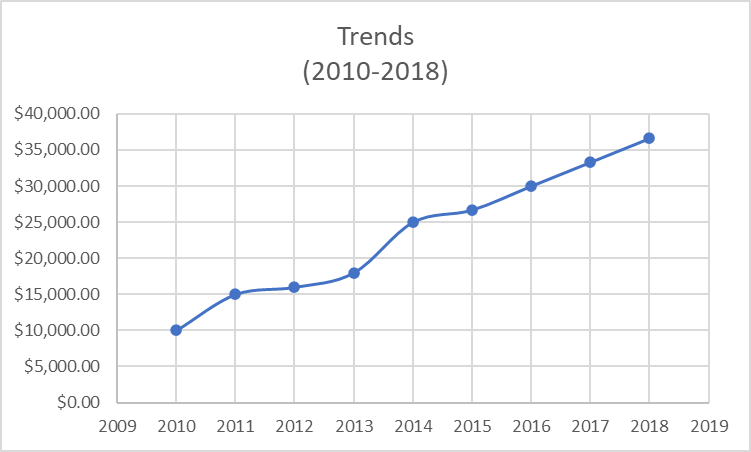
As we can determine from our calculations, GROWTH, and TREND functions don't give us the same answers, but they show that the company is growing at a healthy rate.

Free Resources
To continue learning and advancing your career, check out these additional helpful WSO resources:


or Want to Sign up with your social account?