STDEV Function
Function in Excel to estimate deviation from the mean for a sample


What is the STDEV Function?
The STDEV function uses Excel to estimate deviation from the mean for a sample. To calculate the standard deviation for an entire population, the user should use the STDEV.P function.
Its usefulness is rooted in the highly customizable nature of the function; one can specify or adjust different data ranges based on their needs using STDEV. This is not possible with the manual formula calculation of standard deviation, where large datasets get tedious.
Standard deviation is closely related to variance, reflecting the variability in distribution. The reasoning behind taking a square root is to ensure the STDEV measure is in the same units as the original data.
This is particularly useful in finance as it helps investors understand the risks associated with an asset class or portfolio. By providing insights into the degree of volatility or uncertainty in returns, standard deviation plays a major role in contextualizing risk tolerance for analysts.
Interpreting STDEV values is straightforward; a higher number typically means greater variability in returns, while a low standard deviation suggests that returns do not deviate significantly from the mean.
Additionally, the efficient management of risk leads to better investment decisions, which in turn improves performance. Hence, investors rely on the STDEV function as a foundation for risk management.
- The STDEV function in Excel estimates the deviation from the mean for a sample, while STDEV.P is used for the entire population. Its customizable nature allows users to specify data ranges based on their needs.
- To use the STDEV function, either navigate through the Formulas tab or directly type the syntax (=STDEV(number1, [number2]...)) in an empty cell. Default behavior assumes the standard deviation of a sample.
- A high standard deviation indicates greater variability, while a low standard deviation suggests less dispersion.
- In finance, higher STDEV implies higher risk, making it valuable for risk assessment when used alongside industry-specific knowledge.
STDEV Function Formula
The standard deviation formula is intuitive, but one needs to be careful with the desired terminology. For example, there is a slight difference when calculating the STDEV of a sample as opposed to the STDEV of a population.
This requires a small tweak in the formula, but the standard deviation of a sample is the preferred calculation, as that is what most professions look for.
If the entire population is available, then STDEV.P would be appropriate, but if the data is exhaustive, taking a sample of it using STDEV.S will save time and provide an outlook on the entire population's behavior.
The STDEV function syntax can be expressed as follows:
=STDEV(number 1, [number 2]...)
These numbers represent an array of observations, and the function calculates the variation within these data points. It automatically assumes the standard deviation of a sample, but one can change the syntax to STDEV.P to calculate for the whole population.
Note
Be careful to prevent any errors in the syntax, a #DIV/0! Error occurs if less than two numbers are entered in the STDEV argument. The values must also be numerical; otherwise, it will return a #VALUE Error.
How to use the STDEV Function in Excel?
To use the STDEV function in Excel, follow these steps:
- Navigate to the cell where you want the result: Select the cell where you want to display the standard deviation.
- Access the Formulas tab: Go to the "Formulas" tab on the Excel ribbon.
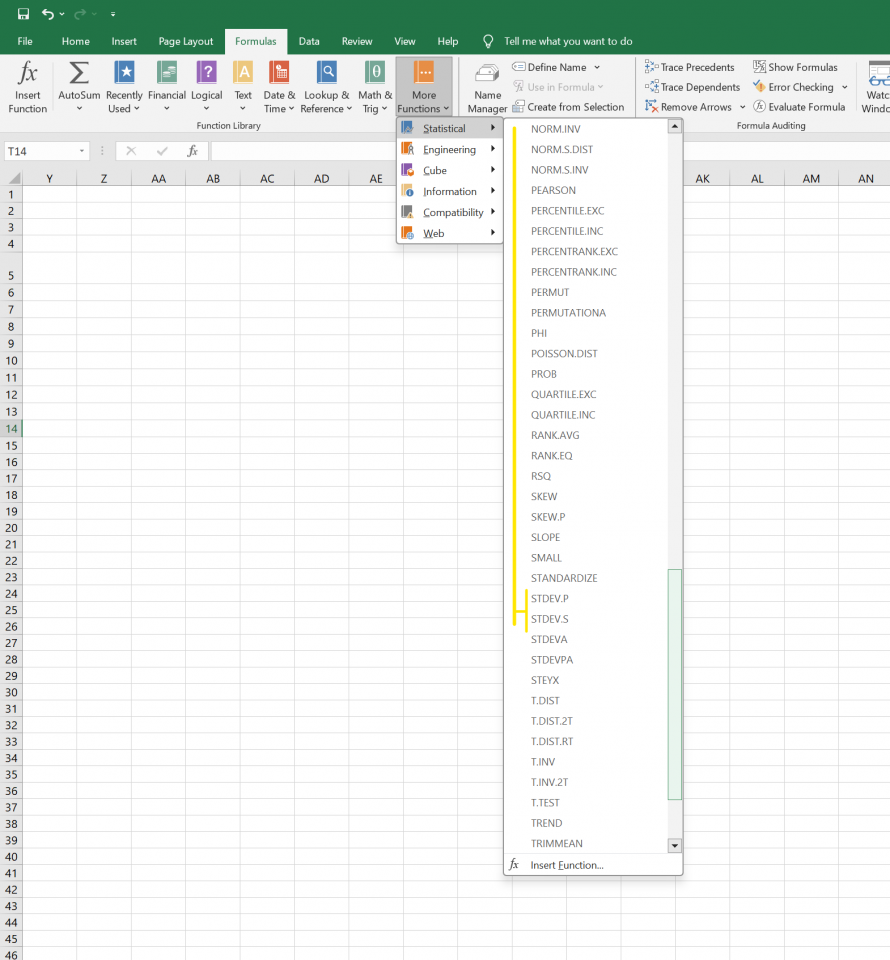
- Choose the Statistical category: Within the Formulas tab, click on the "More Functions" drop-down menu in the "Function Library" group.
- Select STDEV from the Statistical category: Choose "Statistical" from the drop-down menu and then select "STDEV" from the list of functions.
- Enter the data range: A dialog box will appear. Enter the range of data for which you want to calculate the standard deviation. You can manually select the cells or type the cell range directly.
- Close the dialog box: Click "OK" to close the dialog box, and Excel will automatically calculate and display the standard deviation in the selected cell.
Alternatively, we can simply select an empty cell and type the STDEV function directly using the following syntax:
=STDEV(number1, [number2], ...)
Replace "number1," "number2," etc., with the actual range or individual values you want to calculate the standard deviation.
Remember the difference between a sample and a population. By default, Excel's STDEV function assumes a sample. If you have the entire population, consider using STDEV.P for the population standard deviation.
STDEV Function Example
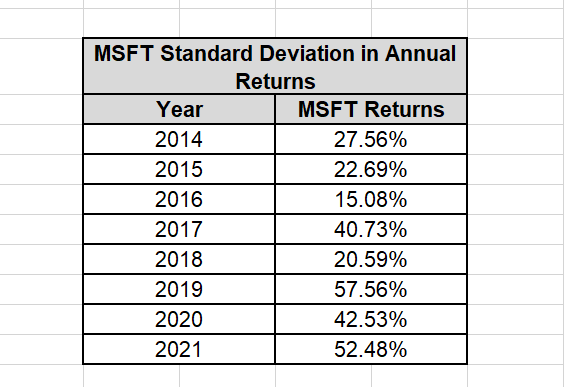
To illustrate how standard deviation works in the equation form, one can use a dataset for yearly MSFT returns from 2014 to 2021.
By calculating the STDEV of this sample, one can accurately find the variation in returns; this gives a clearer picture of its potential volatility in the future.
Let’s look at the data given in the image below:
Now, to calculate the Standard Deviation, we’ll use the STDEV.S syntax:
=STDEV.S(number 1, [number 2]...)
Firstly, we’ll select the range for which we need to calculate the standard deviation. Here, it is the MSFT Returns.
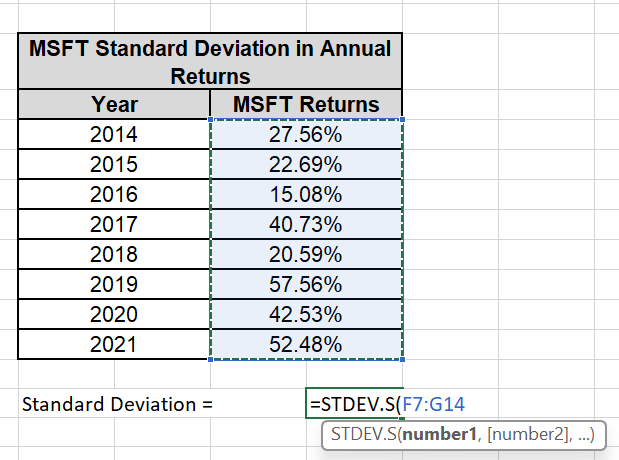
Now, we’ll let Excel calculate the deviation.
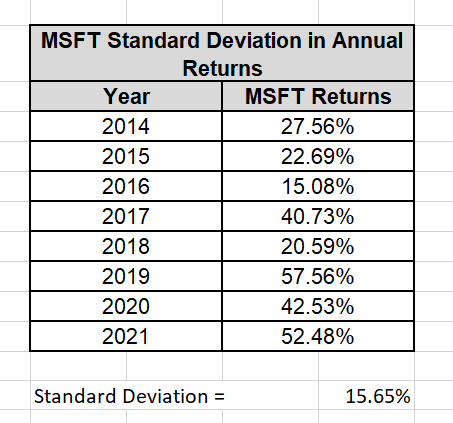
Upon calculating, we got our standard deviation as 15.65%
Note
When using STDEV as the function syntax, it will automatically assume one is calculating the standard deviation of a sample. To find the standard deviation of a population, the function syntax must be changed to STDEV.P before plugging in any numbers.
Standard deviation is easier to find using the STDEV function instead of manually calculating it using the equation. However, one must be careful to avoid any mistakes in the syntax to get the desired output.
Interpretation of Standard Deviation Values
While the STDEV function provides you with the standard deviation of a dataset, it is important to understand the meaning behind that number. In most cases, this is context-based and depends on the specific field of study.
For instance, when analyzing returns in financial markets, it is natural to have a greater standard deviation spread than in pharmaceutical manufacturing, where there is less room for STDEV swings due to strict quality control measures.
When looking at the standard deviation value for a data field can be classified into three categories:
- High Standard Deviation: When the data points are widely spread out around the mean, this results in high variability and significant differences between observations.
- Moderate Standard Deviation: A decent amount of dispersion is seen in this case; individual observations are moderately away from the sample mean, and some variability exists within data points.
- Low Standard Deviation: If the STDEV value is close to zero or a very small value, all observations are closely clustered around the mean, and there is very slight dispersion in the data. Each data point is relatively similar to one another.
Interpreting in Finance
This concept can be extrapolated to risk assessment in finance. If investment returns have a higher STDEV, it implies greater risk is involved due to increased volatility in returns.
On the other hand, risk-averse investors would look for investments with a low standard deviation because that denotes less volatility in returns, considerably reducing risk.
While standard deviation is an incredibly useful tool, it must be looked at alongside industry-specific knowledge and other statistical measures to gain a comprehensive understanding of the data being analyzed.
Summary
STDEV is a powerful Excel function that calculates the standard deviation of a dataset efficiently and quickly. It has widespread applications ranging from risk management in finance to drug testing and climate science evaluation.
The function's flexible nature means that it can be used on a wide array of datasets, and its syntax can be changed depending on whether the STDEV of a sample or population is required.
By accurately calculating the standard deviation of a dataset, one can get a proper understanding of how the data behaves, leading to improved analysis and decision-making.

Researched and Authored by Amrit Kachroo | LinkedIn
Free Resources
To continue learning and advancing your career, check out these additional helpful WSO resources:


or Want to Sign up with your social account?