CONFIDENCE.T Function
An Excel Statistical Function that is utilized by the users to calculate a confidence value that constructs the confidence interval for a population mean based on the specified mean and sample size.
What Is The CONFIDENCE.T Function?
The CONFIDENCE.T function is an Excel Statistical Function that is utilized by the users to calculate a confidence value that constructs the confidence interval for a population mean based on specified mean and sample size.
A confidence interval is the range of values the population parameters will fall in for a certain percentage of times. The user chooses this percentage, but it is most often 95%.
Jerzy Neyman introduced the idea of confidence intervals in 1939, and statisticians quickly adapted it to their work. Today, confidence intervals are widely used across many professions.
Confidence intervals also have implications in finance, as they are tools for assessing a stock's value and can help analysts determine whether a certain stock is a good “buy.”
Because it is a very helpful tool throughout all analytical fields, it would be important to learn how to input values into an Excel formula and understand its mathematical reasoning. This article will use a more basic example without overcomplicating the math.
Key Takeaways
- The CONFIDENCE.T function is an Excel statistical function that calculates the confidence interval for a population mean based on a student's t-distribution.
- The CONFIDENCE.T function calculates the confidence interval for the population mean using the Student's t-distribution. Based on a sample mean and sample size, it helps estimate the range within which the true population mean is likely to lie.
- The CONFIDENCE.T function may return an error if the specified alpha value is outside the valid range (typically between 0 and 1) or if any input arguments are invalid.
- The CONFIDENCE.T function requires numerical values for its arguments. It may return an error if the input arguments are non-numeric or invalid.
Statistics Behind the T Confidence Interval Test
It is important to learn about the math behind the t-confidence interval before learning about Excel’s shorthand methods. This way, you will better understand what is occurring using this confidence test.
A few assumptions must be checked each time before calculating the confidence interval to ensure the interval is accurate.
- The sample used to extrapolate the true mean for the population must be random.
- Each value in the data set must be independent of the others.
- The population should be a normal distribution.
Before approaching any problem, you should know three pieces of information:
- Sample size: denoted with n
- Population standard distribution: denoted with s and assumed to be a given in most scenarios
- Sample mean: denoted with x̄, called “x bar,” where;
x̄ = Σ/n
Say you are looking for a 95% confidence interval, which means 95% of all the data would lie between that range, with 5% that lies outside.
First, we must determine the t value of the distribution’s bottom and top 2.5%. We need to know our degrees of freedom and confidence level to do this.
The degrees of freedom (df) can be estimated by subtracting 1 from the sample size, the formula being:
df = n - 1
We already established our confidence level to be 95%.
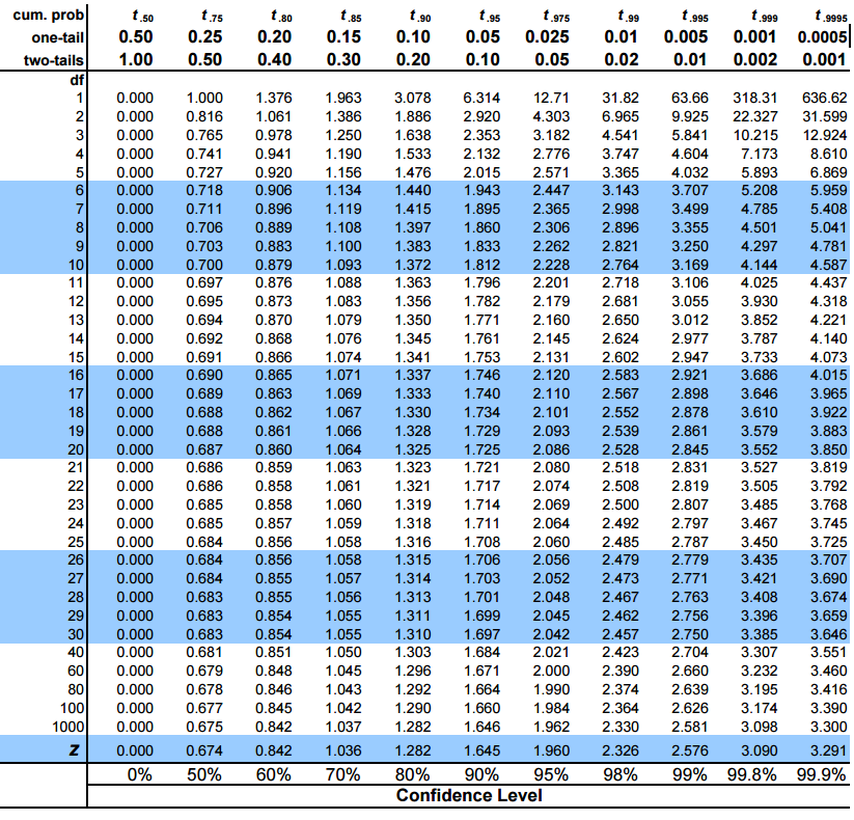
Using the table below, we can find the t value. The t value for the top 2.5% is this exact value, and the t value for the bottom 2.5% is the negative of this value.
Next, we need to calculate the standard error (SE). This is done by dividing the sample standard distribution by the square root of the sample size, which is:

Finally, we can multiply the standard error by the t value to get the value needed to calculate our upper and lower values, which can be done by adding or subtracting it from the sample mean.
Upper Bound = x̄ + (SE * t)
Lower Bound = x̄ - (SE * t)
From here, we can construct a sentence that summarizes our findings:
Note
“We are 95% that the true mean of the population of [thing the population is for] lies between [lower bound value] and [upper bound value].”
CONFIDENCE.T Formula
As can be seen above, calculating a confidence interval by hand is tedious. Thus, using an Excel function can help you calculate it more quicker.
The formula is
=CONFIDENCE.T(alpha,standard_dev,size)
Where,
- alpha (required): The significance level. It can be calculated by subtracting the confidence level from 1. The confidence level is typically 95%; in these cases, the significance level is 5%, or .05
- standard_dev (required): The standard deviation
- size (required): Size of the sample for which we are calculating the interval from
To increase the efficiency of using the confidence interval test on Excel, we can use functions to help calculate different parts needed to get the confidence interval.
We can use the count function to count the number of elements in a given cell range. The function is
=COUNT(value1:value2),
where value1 and value2 enclose the cell range for which you would like to find the number of elements present. It is possible to use specific cell names and separate them with commas. However, this is not as efficient in the situation present.
Note
Using the standard deviation and count functions will reduce the chances of a mathematical error and reduce the time needed to calculate the output of CONFIDENCE.T.
CONFIDENCE.T’s output is the distance from the mean that we are a [certain confidence level of confident] that values will lie between.
A widely accepted way to interpret the output is by saying, “We are [confidence level percentage] confident that the true mean lies between [sample mean you have] ± [output of CONFIDENCE.T].”
While the formula does not ask for the mean, it is still needed to interpret the output of the function. We can calculate the mean by using
=AVERAGE(number1:number2),
where number1 and number2 are the cell names that enclose the values you would like to find the mean for. Instead of using a range, it is possible to use cell names or mathematical values and separate the names or numbers with commas. However, these are less common.
T Confidence Interval Example
Say you are asked to find a 95% t confidence interval using the random sample of the following 10 biology exam scores, given that 100 students took the exam.
Assume the population is normally distributed, and the standard deviation is 13.68 (this happens to be the sample standard deviation, but they are usually not the same).
The data is shown in the table below:
| n | n=1 | n=2 | n=3 | n=4 | n=5 | n=6 | n=7 | n=8 | n=9 | n=10 |
|---|---|---|---|---|---|---|---|---|---|---|
| Biology Exam Scores | 91 | 97 | 59 | 64 | 73 | 87 | 82 | 77 | 98 | 68 |
Before doing any calculations, we need to ensure a t confidence interval would be appropriate in this situation.
- According to the problem, the sample is random; it contains 10 randomly selected exam scores.
- It can be reasonably assumed that each exam score is independent of the others, as cheating would be immoral, and the students here are (hopefully) good people.
- According to the problem, the population is normally distributed.
Since the problem passes the conditions, we can proceed with the actual calculations. First, let us solve this problem by hand.
Step 1: Figure out the mean, standard deviation, and the number of test scores.
We can calculate the mean by plugging in the appropriate values into the formula:
x̄ = Σ/n
x̄ = (91 + 97+ 59 + 64 + 73 + 87 + 82 + 77 + 98 + 68)/10
x̄ = 79.6
Step 2: Calculate the degrees of freedom:
df = n-1
df = 10-1
df = 9
Using the table below, we can calculate the t value for our distribution.
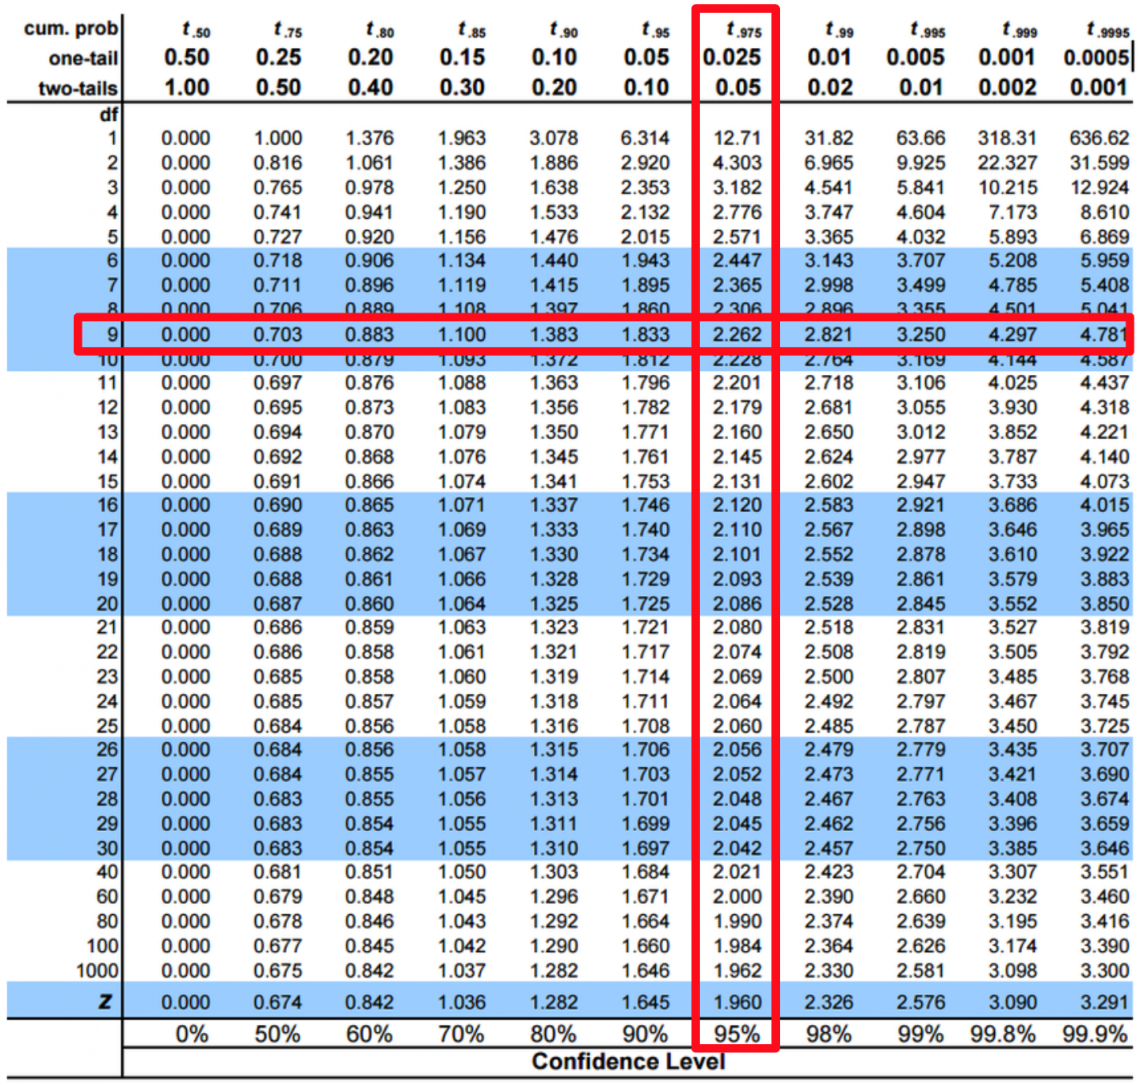
This table indicates that our t value is 2.262.
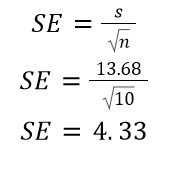
Step 3: Determine the standard error for the sample:
Step 4: Determine the confidence interval
After calculating all the values above, we can determine the confidence interval in our final step.
Upper Bound = x̄ + (SE * t)
Upper Bound = 79.6 + (4.33 * 2.622)
Upper Bound = 79.6 + 9.79 = 89.39
Lower Bound = x̄ - (SE * t)
Lower Bound = 79.6 - (4.33 * 2.622)
Lower Bound = 79.6 - 9.79 = 69.81
From this, we can say we are 95% confident that the true mean of students’ biology exam scores lies between 69.81 and 89.39.
As we can see, doing this much math can be tedious. Thus using the Excel function can speed up the process and reduce the chances of a mathematical error.
CONFIDENCE.T Function Example
As a refresher, the Excel formula is
=CONFIDENCE.T(alpha,standard_dev,size)
We can break down each argument now to determine what values should go in each part:
- Because the problem requires a 95% confidence interval, the significance level will be 5%, entered as .05.
- standard_dev can be calculated either by hand or in Excel using the standard deviation function.
- size is the sample size, 10 in this case.
Before we type the Excel formula for the confidence interval, let's use Excel functions to automate the different arguments of CONFIDENCE.T.
We can use the count function to calculate the size argument of Excel’s CONFIDENCE.T. The syntax is =COUNT(value1:value2).
While it may seem overkill to use it in this example, as the problem already provided us with the size, and because the size is small enough to count, it is still good practice and will help in a more complex situation.
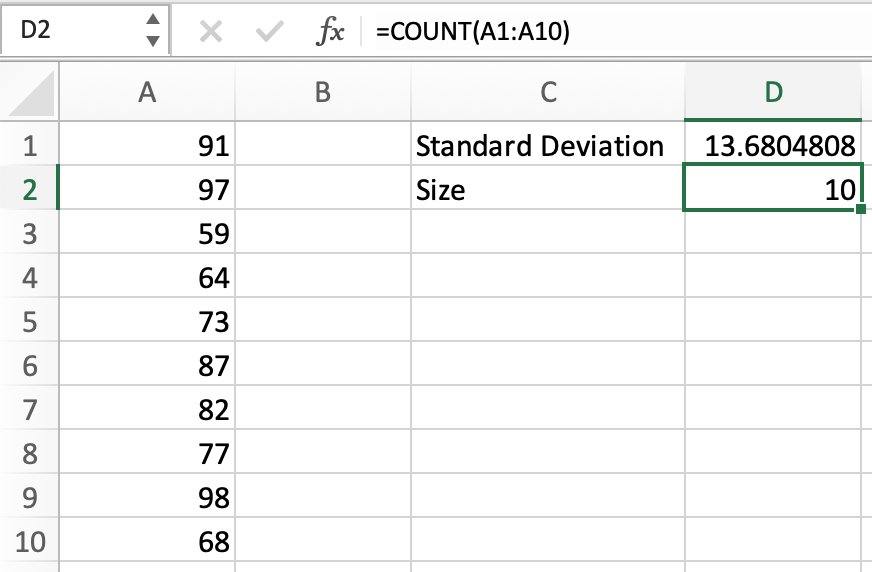
We can now use D1 and D2 in the CONFIDENCE.T formula, plugging them in instead of having to calculate each D2 and type it in manually, which looks like this:
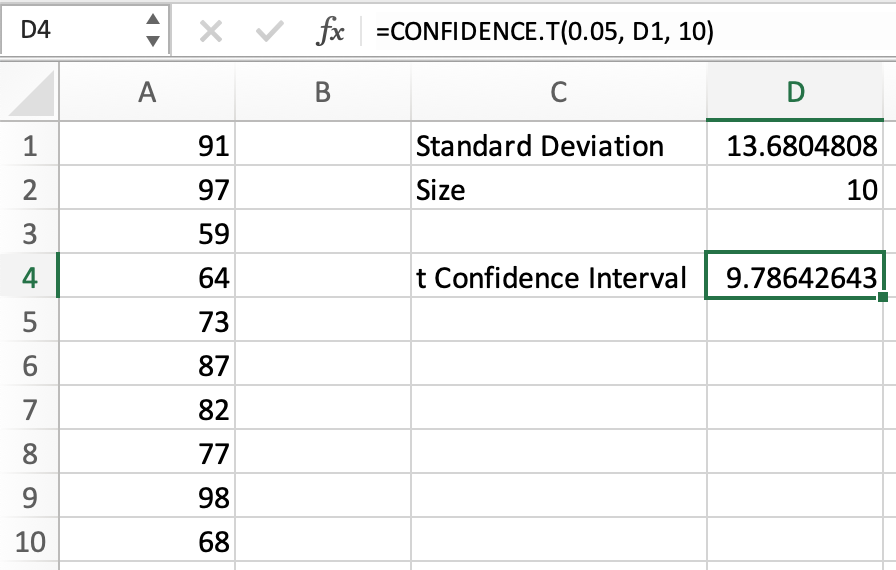
This formula returns 9.79, the same value we calculated when we did this same problem by hand.
However, we are not done yet. We still need to find the mean to determine the upper and lower bounds of the interval for the true mean. As discussed earlier, we can use =AVERAGE(number1:number2), which would look like this:
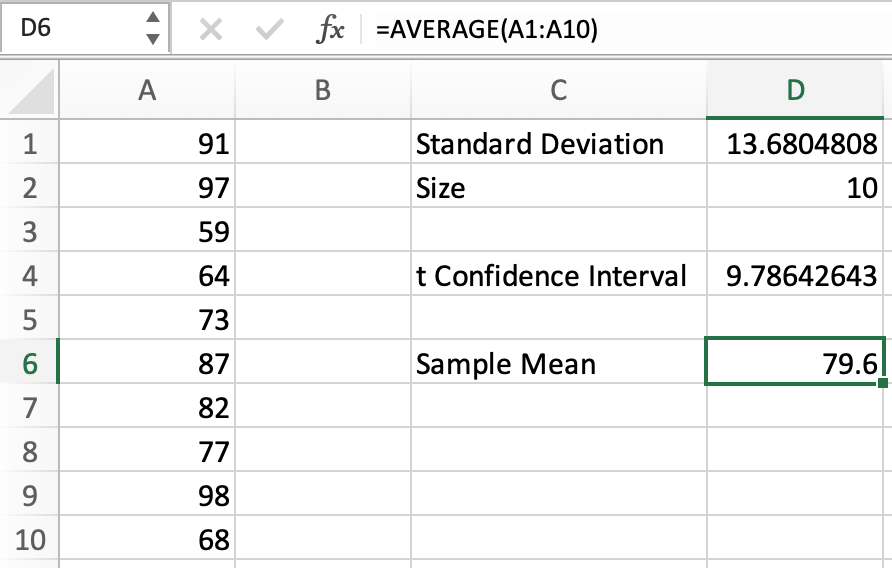
Again, note how the sample mean here is the same as what we calculated earlier. Now that we have all the components, our last step is calculating the upper and lower bounds of the range, which can be done by adding and subtracting in Excel.
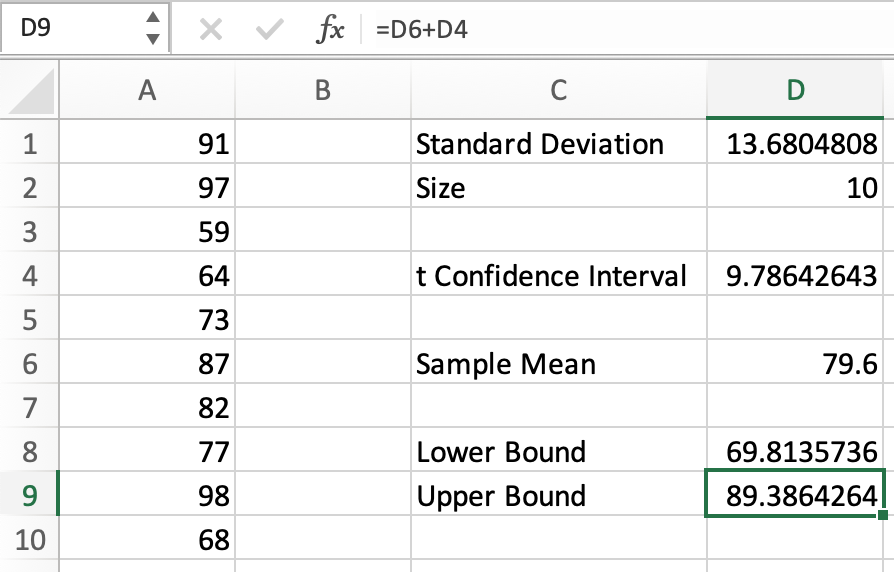
Here we get the same results as we did earlier, and we can still say that we are 95% confident that the true mean of the biology exam scores lies between 69.81 and 89.39.
Free Resources
To continue learning and advancing your career, check out these additional helpful WSO resources:


or Want to Sign up with your social account?