Standard Error
Measures the variability of a sampling distribution


What Is A Standard Error?
Standard error (SE), in statistics, measures the variability of a sampling distribution, i.e., it is the estimate of the standard deviation. It measures the variability of sample means, indicating how much the sample means are expected to differ from the true population mean.
It is a widely used measure in finance, often seen as part of regression analysis. The sampling distribution of the mean is calculated by repeatedly taking the means of random samples from the population.
The distribution of the means recorded from this exercise has its own mean and variance. The standard error is the square root of the variance of the sampling distribution of the sample mean.
- Standard Error (SE) is a statistical measure that estimates the variability of a sampling distribution, serving as an estimate of the standard deviation.
- It indicates how much sample means are expected to deviate from the true population mean.
- Mathematically, the standard error (SE) is calculated as the population standard deviation (σ) divided by the square root of the sample size (n).
- Increasing the sample size or population can help reduce the standard error, but a balance must be struck between cost and accuracy.
- Widely used in finance, especially in quantitative finance, standard error is a crucial metric for understanding the uncertainty associated with average or expected values, such as investment returns.
How To Calculate Standard Error
Mathematically, the standard error is equal to the standard deviation of the distribution divided by the square root of the number of observations. The distribution of sample means usually follows a normal distribution, as per the Central Limit Theorem.
SE can be calculated as:
SE = σ / (n)½
where,
- σ: Population standard deviation
- n: Sample size or the number of observations in the sample
Given the equation above, we can see that the population or number of observations must be increased to lower the error term (standard error). This is logical, as the sample mean will be closer to the population mean as the size of the sample increases.
However, increasing the number of observations may not always be practical and could be costly. Hence, it is important to strike the right balance between cost and accuracy.
Standard Error In Finance
Standard error is a commonly used measurement metric in finance, especially in quantitative finance, which involves the use of statistical analysis of data.
Its most prominent use is as part of regression analysis, which is used to understand the characteristics of the population from a sample.
In finance, standard error is like a measure of how uncertain we are about the average or expected value of something, such as an investment's returns. It helps investors understand the reliability of their predictions.
A smaller standard error suggests more confidence in the estimate, while a larger one indicates greater uncertainty. It's like saying, "I expect my investment to grow by around 5%, but I'm not exactly sure, and here's how much I might be off."
So, in finance, standard error is a tool to gauge and communicate the level of uncertainty associated with financial predictions.
Standard Error In Regression Analysis
In regression analysis, the standard error is often called the error term. It measures how far observations fall from the regression line.
Below is an example of a regression; the orange points represent the standard error of the regression. Each orange point has a different distance from the regression line, and the SE will measure the precision of the estimate of the regression line.
Example Of Standard Error In Regression Analysis
Let's assume an analyst would like to run a regression on the return of a market ETF and the number of cold days in a month. The data the analyst gathered is provided in the table below.
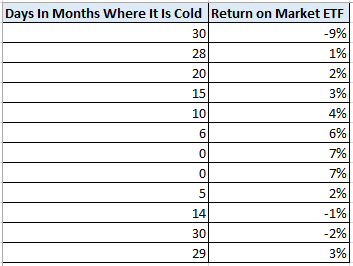
Using Data Analysis in Excel, the analyst gets the below output.

The analyst recalls that the standard error measures the average distance the monthly returns fall from the regression line. In this regression, the returns, on average, the returns are about 8.47 times the standard error away from the regression line.
To better visualize the regression and standard error, the analyst plots the regression in Excel (picture below).
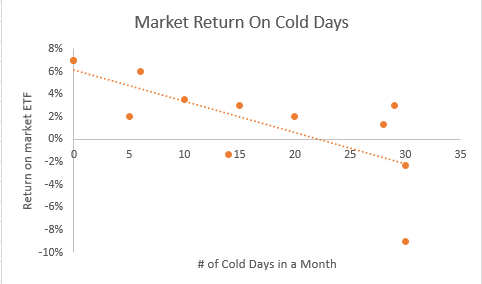
In the regression above, some of the orange points touch the line, while others are very far away; on average, the returns are 8.47 standard deviations away from the regression line.
The standard error can help predict where observations will fall along the regression line. The regression above was used with 95% confidence, meaning that 95% of all returns should fall within +/- two standard deviations of the standard error.


Standard Error Vs. Standard Deviation
Standard error and standard deviation are often confused because they both measure the variability of a distribution, but the distribution being measured is different.
The standard error is the standard deviation of a statistical measure, such as the mean. In other words, it measures how the means of distribution are distributed amongst each other.
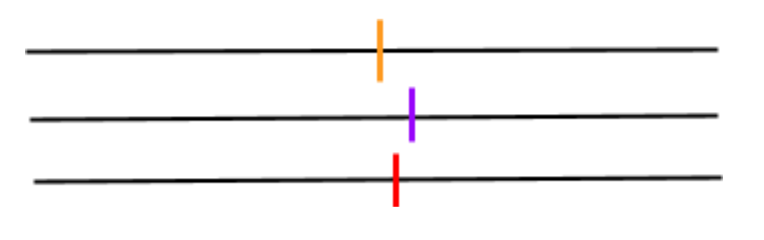
For example, let’s assume an analyst would like to measure the variability of the means of three investments within a portfolio. The analyst first calculates the means of the three distributions (the vertical lines on the horizontal lines below).
They then calculate the standard deviation of the means of the three distributions and divide the standard deviation by the square root of the size of the total population. They have effectively calculated the standard error of the means, not the total distribution..
Standard deviation measures how the data is distributed around the mean of the distribution.
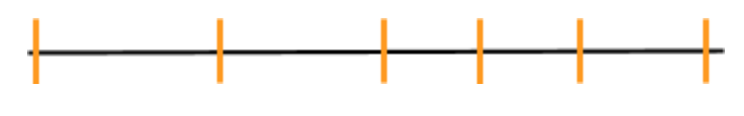
Let’s assume the same analyst would like to see the variability of returns for one investment over a six-day investment horizon. The returns are highlighted on the number line below.
The analyst first calculates the mean and variance of the returns and then takes the square root of the variance to calculate the standard deviation of the six returns. The standard deviation tells the analyst the variability of the returns around the mean.
Standard Error Vs. R-Squared (R2)
When looking at the variability of a distribution, standard error isn’t the only metric an analyst must pay attention to. Other statistical metrics are also looked at. One such metric is R-squared (R^2).
SE measures the precision of the sample mean estimate, while R-squared measures how well the independent variable can explain the variable we are measuring (dependent variable).
In the example where the analyst wanted to see how the market performed when there were more cold days in a month, the returns were measured as the dependent variable. The number of cold days is the independent variable.
Below is the same output from the example.
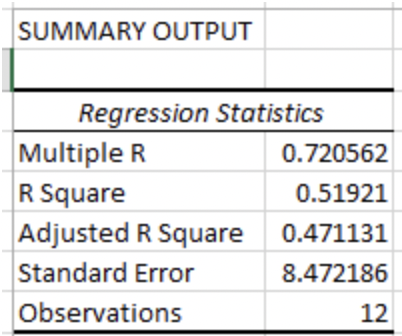
The R-square for the regression tells us that roughly 52% of the variance of returns can be explained by the number of cold days in a month.

Everything You Need To Master Excel Modeling
To Help You Thrive in the Most Prestigious Jobs on Wall Street.
Free Resources
To continue learning and advancing your career, check out these additional helpful WSO resources:


or Want to Sign up with your social account?