T.INV Function
This function calculates the inverse of the Student’s t-distribution.
What is the T.INV Excel Function?
The TINV Excel function is a statistical function that works with probability and degrees of freedom. Degrees of freedom are associated with logically independent values and can be related to hypothesis testing within statistics.

The function will help calculate the opposite of a student's t-distribution. Well, some of you may ask what the student's t-distribution is first of all. It is a graph that is symmetrical and bell-shaped.
Often people may use these t-distributions for statistical analysis. A t-distribution will appear when there is an estimation of the mean of a normally distributed population where the sample size is small. The standard deviation of the population is also unknown for the t-distribution.
Statistics are often used in various workplaces. They are used in the business industry and the physical and social sciences. Aside from those industries, they are used in humanities and even manufacturing.
The function's return of the opposite of the student’s t-distribution is also known as returning the t-value.
Key Takeaways
- TINV Excel Function computes the inverse of the Student’s t-distribution, essential for statistical analysis.
- It necessitates numeric arguments, specifically probability and degrees of freedom, ensuring accurate calculations.
- Primarily utilized for hypothesis testing, it serves as a fundamental tool in statistical analysis within Excel.
- The function's versatility and precision make it indispensable for a wide range of analytical tasks, empowering users in data-driven decision-making processes.
Understanding the T.INV Excel Function
The TINV formula in Excel is as follows:
TINV(probability,deg_freedom)
When you enter it into Excel, your formula will look like the following:

Before putting the function to use, it is important to know what is required and what is optional within the formula. Additionally, it is also good to know what each argument within the formula looks for. This all can be helpful later on to avoid any error delays.
Note
When entering a formula in Excel, always start the formula with an equal sign.
The formula for the TINV function contains the following two arguments:
- Probability: It is required and will be the probability that is associated with the two-tailed Student’s t-distribution.
- Deg_freedom: It requires the number of degrees of freedom to characterize the distribution.
When working on Excel, it is important to be familiar with what the function requires and what is optional. This will help avoid any future errors and delays with your work. When working with the TINV function, it is important to know of some of the possible errors you may encounter.
When entering your argument for probability and deg_freedom, you may get a #VALUE! Error if your entry is non-numeric or negative.

As for the first argument probability, there is also another chance of getting a possible error. If, for the argument, your entry is less than or equal to zero, you will get a #NUM! error. The error can occur again if it is also greater than one.
For the second argument, deg_freedom, if the value is not an integer, then it will be cut short. However, if it is less than one, it will give a #NUM! error for the function.
Another error that you may encounter is the #N/A error. This will result when the function cannot calculate the inverse of the t-distribution. If this occurs, you can double-check your work and see if your probability is too small or big and if the second argument is too low.
Excel TINV Function Example
Now that we know more about the function let’s apply it to an example. We will have the following data as follows:
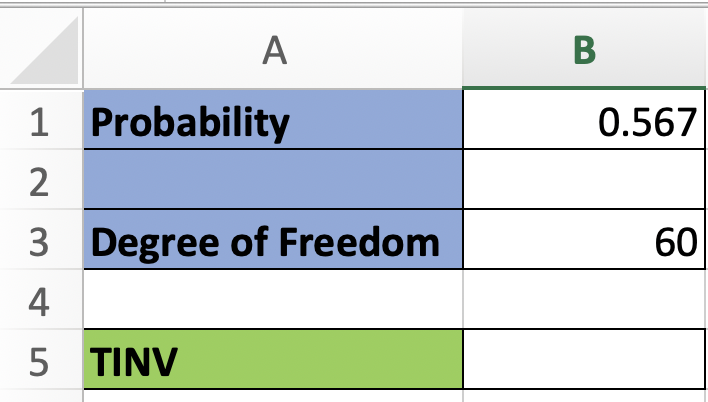
The value for the probability will be the number that is associated with the Student’s two-tailed distribution. Our degree of freedom will be 60. Now that we have this information, we will enter it for the TINV function.
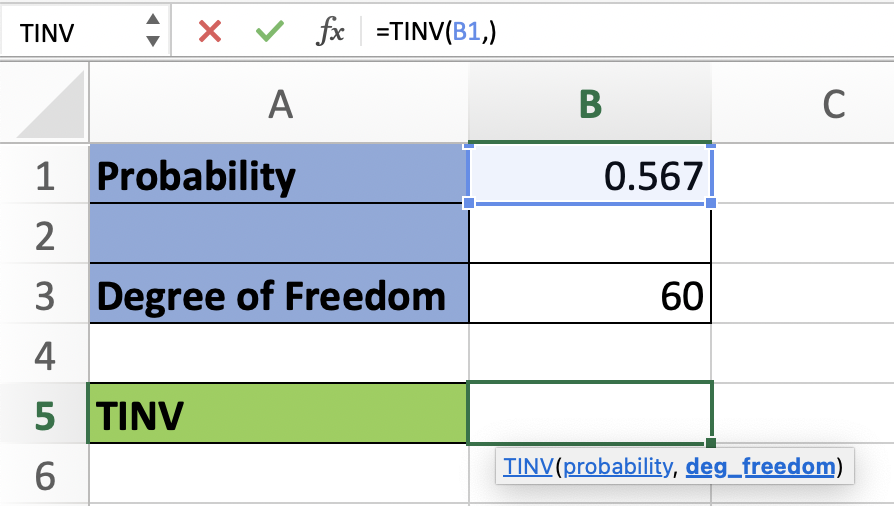
The first argument for entering is probability. You can enter it by entering the number or simply selecting the cell with the number. In this case, it was cell B1.
Note
When working on entering the formula, you need to add a comma (“,”) after an argument; if not, the system will not recognize the following argument
For the second argument, you will select the cell with the number 60. After entering the required argument, you can press enter to compute the outcome. The results will be the following:
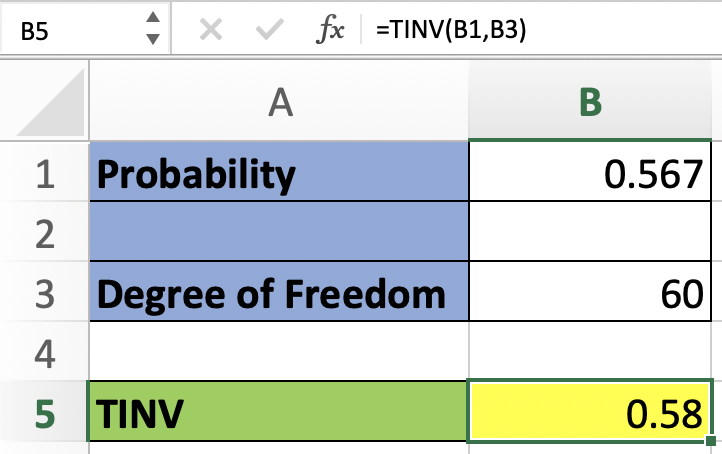
The result you obtain from using the function is the t-value of the Student’s distribution that was based on the two arguments: probability and degrees of freedom.
If your probability had been zero, then it would have resulted in the #NUM! Error. It will look like the following:
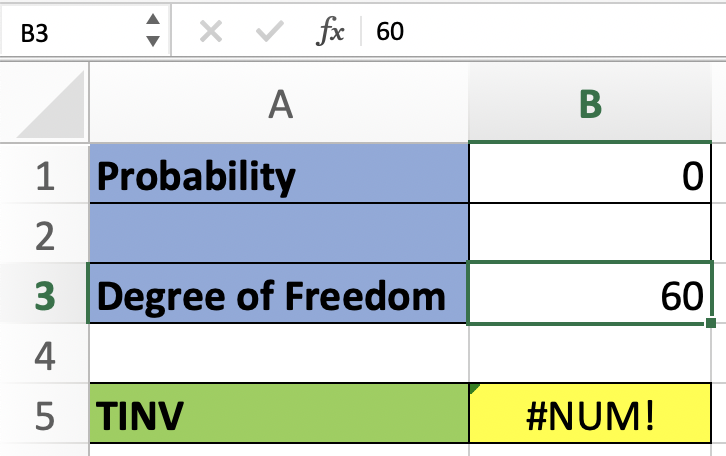
We would get the same result if the degrees of freedom were to be less than one. If we take into consideration the formula and the requirements of the arguments, we can avoid those errors.
Now let’s calculate the TINV again, but with different values; the data will be as shown below.
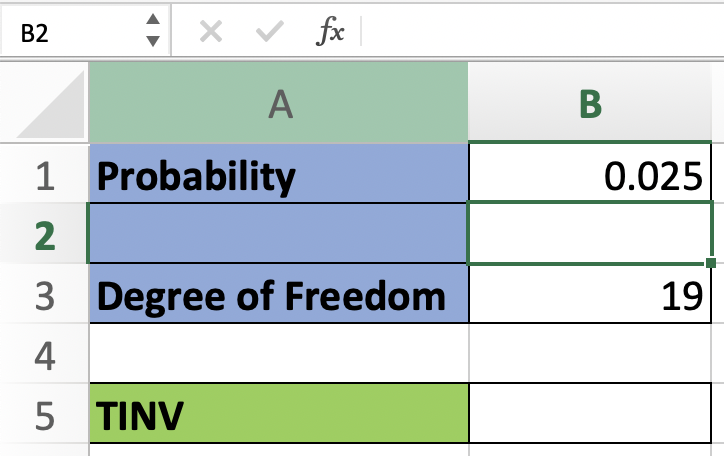
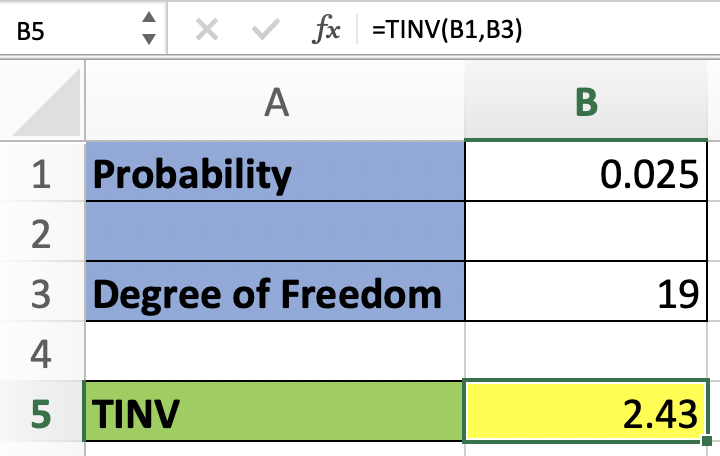
Now that our needed data is available, we will then enter the function and the needed arguments. Once the arguments are entered, we proceed to the results of the function. The results will be as follows:
Conclusion
The T.INV Excel function, attributed to Friedrich Helmert's statistical advancements, is pivotal for calculating the inverse of the Student’s t-distribution.
Widely utilized in diverse industries for hypothesis testing and statistical analysis, it streamlines decision-making processes. Mastering the syntax and arguments of the T.INV function is crucial for error-free results.
The t-distribution came from Friedrich Helmert in 1876. Excel's TINV function, stemming from Helmert's pioneering work, enables precise statistical computations by calculating the inverse of the cumulative probability density function of the Student's t-distribution.
Users must input numeric values for probability and degrees of freedom, mindful of potential errors like #VALUE!, #NUM!, and #N/A. This understanding enables effective troubleshooting and enhances data analysis workflows.
By leveraging the T.INV function in Excel, users can swiftly compute the t-value of the Student’s distribution, facilitating precise statistical analysis. Its accessibility underscores Excel's commitment to providing robust tools for data analysis and decision-making across industries.
Free Resources
To continue learning and advancing your career, check out these additional helpful WSO resources:


or Want to Sign up with your social account?