CONFIDENCE Function
The function provides a range of values within which the true population mean is estimated to lie with a certain level of confidence.

What is the CONFIDENCE Function in Excel?
The CONFIDENCE function is used to calculate the confidence interval for a population mean, given a sample mean, the standard deviation of the population, and the size of the sample. The confidence interval provides a range of values within which the true population mean is estimated to lie, with a certain level of confidence.
CONFIDENCE.NORM, CONFIDENCE.T, and CONFIDENCE are three functions offered by Excel to identify confidence intervals.

CONFIDENCE.NORM and CONFIDENCE.T are categorized under the statistical functions, while CONFIDENCE falls under the compatibility category.
The CONFIDENCE function was replaced by both CONFIDENCE.NORM and CONFIDENCE.T functions in the 2010 Excel version because they provide improved accuracy, and their names better match their usage. At the same time, the CONFIDENCE function is still accessible for compatibility purposes.
Here's a breakdown of the two newer functions:
- CONFIDENCE.NORM function: Returns the confidence interval for a population mean based on a normal distribution
- CONFIDENCE.T function: Returns the confidence interval for a population mean based on a Student’s distribution
To utilize these functions, one needs a dataset containing a sample mean and sample standard deviation. Statisticians and analysts commonly rely on confidence intervals for making inferences about population parameters with a certain level of confidence.
- CONFIDENCE.NORM, CONFIDENCE.T, and CONFIDENCE are three functions offered by Excel to obtain confidence, which is further used to determine confidence intervals.
- The confidence interval equals the mean ± CONFIDENCE, where CONFIDENCE is determined using one of the functions above.
- There are multiple ways to access functions in Excel – you will most likely use the Formulas tab or manually input the formula in one of the cells in a worksheet.
- The main difference between the CONFIDENCE.NORM and the CONFIDENCE.T functions use different probability distributions as a basis for calculation. Otherwise, the syntax is identical.
Syntax of the CONFIDENCE function
The syntax for the CONFIDENCE function is:
= CONFIDENCE(alpha, standard_dev, size)
Where:
- alpha (required): significance level, which represents the probability of observing a value outside of the confidence interval. It is typically set to 1 minus the desired confidence level. For example, if you want a 95% confidence level, alpha would be 0.05.
- standard_dev (required): standard deviation of the population.
- size (required): size of the sample.
The function returns the margin of error for the specified confidence level.
For example, if you have a sample mean of 50, a standard deviation of 10, and a sample size of 100, you could use the CONFIDENCE function to calculate the margin of error for a 95% confidence level like this:
= CONFIDENCE(0.05, 10, 100)
This would return the margin of error, which can then be used to construct the confidence interval by adding and subtracting it from the sample mean.
Understanding the CONFIDENCE.NORM function
The function provides a value that can be further used to calculate the confidence interval for the data set you are studying.

The confidence interval equals x ± CONFIDENCE, where x is the sample mean of the data set. The sample mean is the starting point, and it lies at the center of the interval.
The CONFIDENCE.NORM function is accessible through one of three methods:
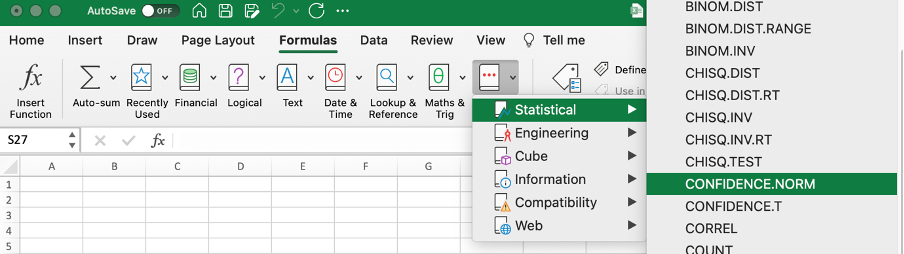
1. The Formulas tab
Located at the top of the Excel spreadsheet, the tab offers you access to all of the built-in functions:
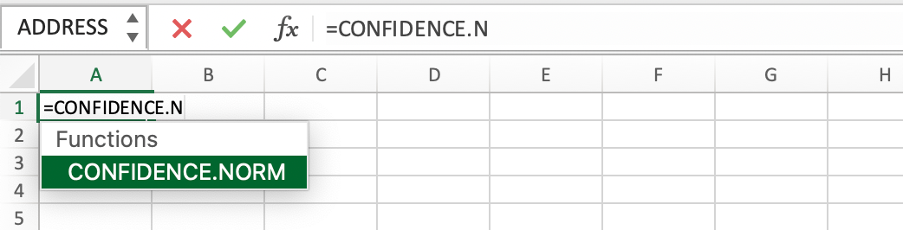
2. Manual input of the function into one of the worksheet cells
This method entails selecting any cell in a worksheet and typing in the function’s syntax:
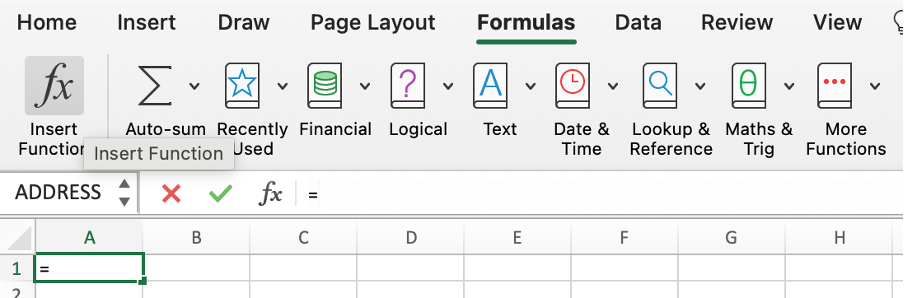
3. Simultaneous use of the Formulas tab and the manual input
Go to the Formulas tab, press on the Insert Function button, and type the function’s syntax in:
The function’s syntax and the arguments are as follows:
= CONFIDENCE.NORM(alpha; standard_dev; size)
where:
- alpha (required): significance level used in the calculation of the confidence level, 100*(1-alpha)%
- standard_dev (required): standard deviation of a data set (known parameter)
- size (required): sample size
Example Of The CONFIDENCE.NORM Function
Let’s assume you want to know how long it takes to successfully prepare for a Level I CFA Exam. You’ve collected the information on 10 candidates who passed the exam and determined the mean and the standard deviation.
As soon as this information is collected, you can proceed with the calculation of the confidence.
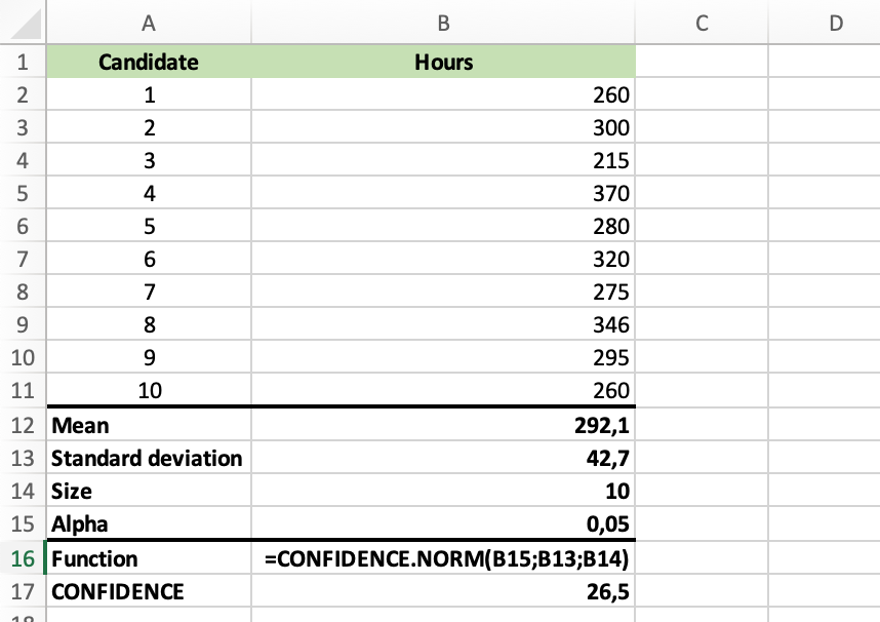
In the example above, a confidence level of 95% is used, which equates to an alpha argument of 0.05. The result means there is a 95% probability that the mean number of hours would fall somewhere between 265,6 (292,1 – 26,5) and 318,6 hours (292,1 + 26,5).
Some of the remarks to keep in mind while using the function:
- The function only accepts numeric values as arguments. In the case of non-numeric values, the #VALUE! error occurs.
- The alpha argument should be ≥0 or ≤1; otherwise, the #NUM! error value is returned.
- The standard_dev argument of zero or lower will cause the #NUM! error.
- The #NUM! error also occurs when the size argument is less than 1.
- The function truncates the size argument number if it is not an integer.
Understanding the CONFIDENCE.T function
Just like CONFIDENCE.NORM, CONFIDENCE.T returns the confidence interval for a population mean. However, it uses a student’s distribution rather than the normal distribution.

The Student’s distribution, also known as the t-distribution, is one of the probability distributions similar to the normal distribution in terms of its bell shape but with heavier tails. It is commonly used with small sample sizes or unknown variances.
The function can be accessed by way of using one of the three methods described above.
The function’s syntax and the arguments are as follows:
= CONFIDENCE.T (alpha; standard_dev; size)
where:
- alpha (required): significance level used in the calculation of the confidence level, 100*(1-alpha)%
- standard_dev (required): standard deviation of a data set (known parameter)
- size (required): sample size
Example Of The CONFIDENCE.T Function
Instead of determining the normal distribution to establish the confidence interval as illustrated earlier, we will opt for determining it using the t-distribution.
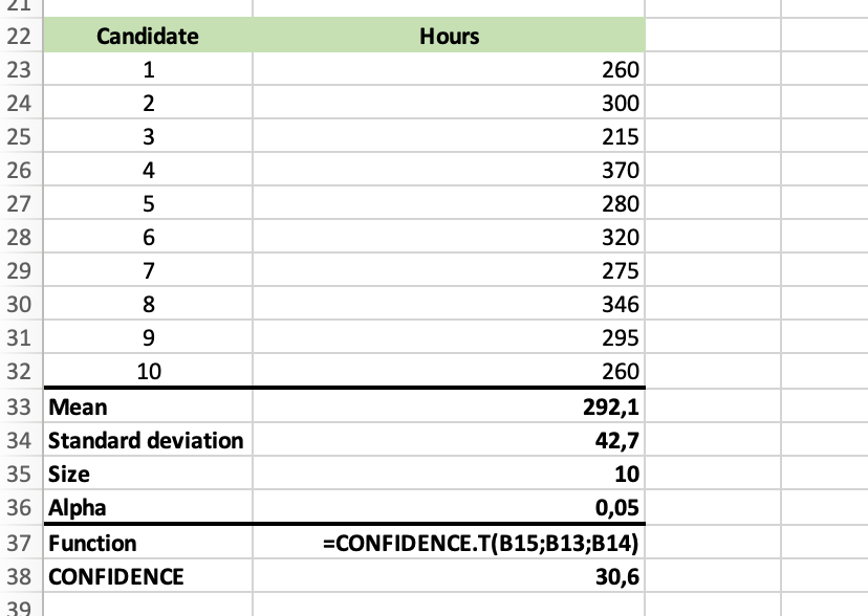
There is a 95% probability that the mean number of hours would fall somewhere between 261,5 (292,1 – 30,6) and 322,7 hours (292,1 + 30,6).
Some of the things to keep in mind when using the function:
- The function only accepts numeric values as arguments. In the case of non-numeric values, the #VALUE! error occurs.
- The alpha argument should be ≥0 or ≤1; otherwise, the #NUM! error value is returned.
- The standard_dev argument of zero or lower will cause the #NUM! error.
- The #DIV/0! error occurs when the size argument equals 1.
- The function truncates the size argument number if it is not an integer.
Comparison Between the three CONFIDENCE functions
Let's compare the three confidence interval functions—CONFIDENCE, CONFIDENCE.NORM, and CONFIDENCE.T based on various parameters
| Comparison Terms | CONFIDENCE Function | CONFIDENCE.NORM Function | CONFIDENCE.T Function |
|---|---|---|---|
| Distribution | Utilizes the normal distribution | Utilizes the normal distribution | Utilizes the t-distribution |
| Assumption | Assumes a large sample size (typically n > 30) or a known population standard deviation. | Assumes a large sample size (typically n > 30) or a known population standard deviation. | Does not require the assumption of a large sample size or a known population standard deviation. |
| Accuracy | May be less accurate for smaller sample sizes or unknown population standard deviations. | Offers improved accuracy over the original CONFIDENCE function, particularly for larger sample sizes or known population standard deviations. | Offers accurate results even for smaller sample sizes or situations with unknown population standard deviations, making it more robust in such scenarios. |
| Example | Conducting a study on the average height of adults in a city where the population standard deviation of heights is known. | Estimating the average score of students on a standardized test when the population standard deviation of scores is known. | Investigating the average monthly income of a sample of freelance workers, where the population standard deviation is unknown and the sample size is relatively small. |
Conclusion
Confidence intervals are vital tools in statistical analysis, offering valuable insights into the precision and reliability of estimates for population parameters.
The introduction of CONFIDENCE.NORM and CONFIDENCE.T in Excel 2010 brought about improvements in accuracy and clarity compared to the original CONFIDENCE function.
Advantages of these functions include their ease of use, built-in accuracy, compatibility with existing spreadsheets, and support for different distributional assumptions.
They also come with limitations. For instance, the functions may be less accurate in certain scenarios, such as when assumptions about the data distribution or population parameters are violated.
However, understanding the assumptions and appropriate usage of these functions is crucial for ensuring accurate statistical analysis in Excel.
By leveraging the right confidence interval function based on the characteristics of the data, analysts can make informed decisions and draw reliable conclusions, enhancing the quality of their data analysis processes.

Everything You Need To Master Excel Modeling
To Help You Thrive in the Most Prestigious Jobs on Wall Street.
Free Resources
To continue learning and advancing your career, check out these additional helpful WSO resources:


or Want to Sign up with your social account?