Durable Goods Orders Report
A way to measure the health of the U.S. economy, released monthly by the government, this statistic helps economists track trends of certain consumer purchases.


What is the Durable Goods Orders Report?
The durable goods orders report is a way to measure the health of the U.S. economy. Released monthly by the government, this statistic helps economists track trends of certain consumer purchases.
Durable goods are products that consumers infrequently purchase because these products are expensive and because they last for at least three years.
This is an economic indicator. Sales increase when the economy is strong because people can afford them more readily. Conversely, when the economy is struggling, people may forgo purchasing these products until a time when they can afford them.
This characteristic is unique to durable goods. Other goods do not help with understanding the economy's well-being as they are not as expensive and cannot be foregone quickly, so their sales stay consistent.
Analyzing these trends can help the government understand spending patterns and create any necessary fiscal or monetary policy to help the economy, which would help increase durable goods sales.
- The Durable Goods Orders Report is a monthly economic indicator published by the U.S. Census Bureau.
- It provides valuable insights into the health and direction of the manufacturing sector, specifically regarding the demand for long-lasting manufactured products.
- Durable goods are products designed to last for an extended period, typically three years or more, without rapid deterioration. Examples include automobiles, appliances, machinery, and aircraft.
- Durable goods are considered a significant component of overall economic activity. Changes in demand for these goods reflect shifts in consumer and business confidence, investment trends, and overall economic health.
Three types of durable goods
According to the U.S. Bureau of Economic Analysis (BEA), the three types are:
- Consumer durable goods
- Business durable goods
- Non-durable goods
Consumer Durable Goods
These are expensive products that households buy that last for at least three years. These can include tangible products like vehicles, appliances, jewelry, furniture, electronics and intangible products like software.
This can be a sound economic indicator, as when the economy is down, households can put off these purchases until they have more money, which happens when the economy treads upward again.
The demand for these goods is also correlated with the interest rates, as most of the high-ticket items are paid in monthly installments.
Business Durable Goods
This includes machinery and other equipment that businesses use and lasts for a minimum of 3 years. Some examples include industrial equipment like engines, transporting means for products like aircraft and trucks, and other general equipment like phones and other electronics.
This can also be a useful economic indicator because businesses tend to make large purchases if they are expecting or experiencing increased revenue and a higher demand for their products.
Non-Durable Goods
Non-durable goods are products that consumers frequently buy because they get used up quickly. These products range from one-time-use items to products that last up to 3 years. Examples include groceries, hygiene products, pharmaceuticals, and clothing.
Even though they are opposites, the BEA classifies non-durable goods as durable. However, these do not offer much insight into economic health. Their purchase tends to stay consistent despite growth or recession because they are inexpensive and have a constant demand.
Durable goods: insight into economic indicators
By interpreting this economic indicator, economists can understand the status of some related economic indicators.
An increased sale of these items means an increased demand for these products. Therefore, increased demand leads to increased supply/production, which means an increasing GDP.
Also, if demand is expected to rise, companies may choose to hire more workers, which also decreases unemployment.
These relationships can be seen as consistent when the opposite happens, and sales decrease. The sales decrease is due to a lowered demand, leading companies to produce less of the product, reducing GDP.
If sales decrease significantly, companies may fire workers to stay afloat, increasing unemployment.
Additionally, investors use these goods to determine how they should invest the company's money. For example, if an investor sees an increased need for machinery over a few months, they may choose to invest in new and efficient technology to keep up with the demand.
Investors need to look at data across several months to determine if it is worth investing in capital. It can take weeks to implement new infrastructure, so it would be most profitable to install the new efficient technology if expecting growth.
Understanding Data from durable goods order reports
The state of the American economy can be gauged by looking at the durable goods orders report. This government-released monthly data aids economists in monitoring patterns in specific consumer purchases.
There are two key ways why the durable goods orders data is helpful:
- The study aids in assessing the economy as a whole and the durable goods sector in particular.
- The state of the economy has a direct impact on household finances. A decline in durable goods sales typically portends a downturn in the economy.
Let us understand the data from the durable goods order report from the examples discussed below.
Example 1: Current Data
Let's interpret some data from current and reasonably recent durable goods order reports.
Using this data, we can see an overall increase in sales, indicating that the economy is in somewhat good health and has been growing. As mentioned earlier, using this data, we can also infer that GDP is likely increasing and unemployment is probably decreasing.
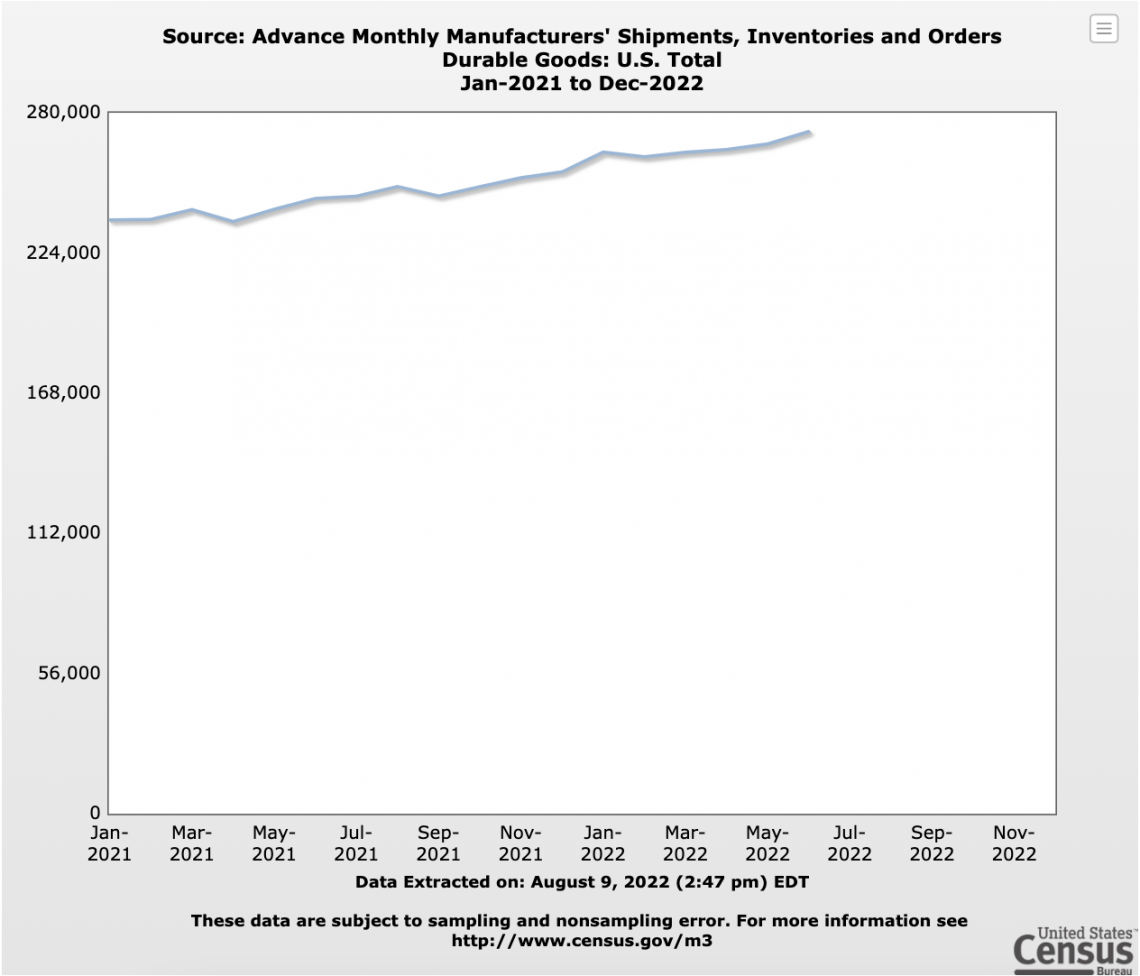
This would make sense because of current events that could affect consumers purchasing durable goods. The fluctuations throughout 2021 and 2022 can be attributed to several different factors, including:
- COVID-19
- Increases in the number of COVID-19 cases hurt the workforce and the economy.
- New variants of COVID-19 left consumers concerned about the economy.
- Supply chain issues due to understaffing from COVID-19-related problems. These issues led to prolonged wait times for people to obtain their purchases and for companies to receive products to restock their inventory.
- Russia-Ukraine War
- The U.S. provides Ukraine with weapons, aircraft, protective equipment, and more, much of which has been produced in the U.S.
- Increasing gasoline prices because the U.S. banned Russian oil imports. Before this, Russia was one of the leading oil exporters to the U.S.
- The side effects of the above factors
- Price inflation is attributed to policies created to help the public during COVID-19. The Federal Reserve (Fed) is increasing interest rates to help lower inflation. Americans will continue to feel inflation until the interest rate returns to pre-pandemic levels.
- The fear of another recession.
Example 2: COVID-19 Recession
Now, look at data during the COVID-19 recession.
This recession began in February 2020 and ended in April 2020, making it the shortest U.S. recession. Therefore, we can focus on these and the surrounding months to understand the data we see in the following graph.
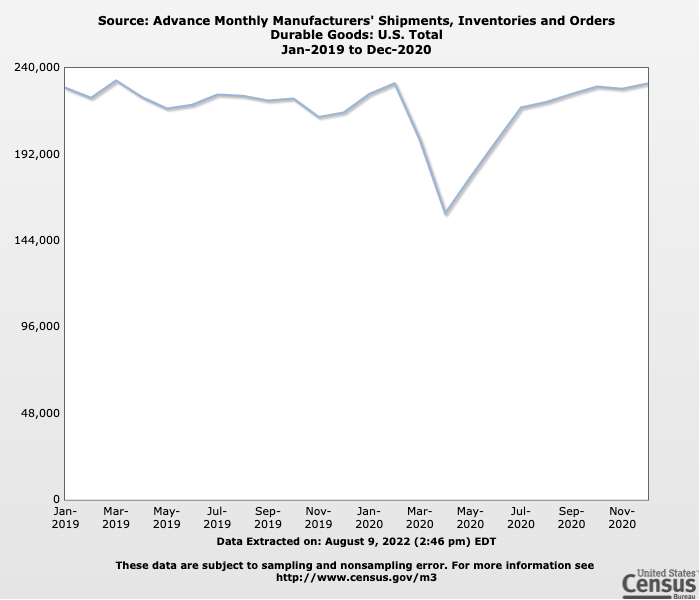
We can see instability beginning in November 2019 and see that the time with the lowest sales is April 2020.
These dates line up with important events. For example, November 2019 was when General Motors' revenue did not increase after strikes, there was a decline in defense aircraft, and issues were being addressed with a failed Boeing design.
April 2020 was the peak of the COVID-19 crisis in the U.S.
The economy was not doing very well during either of these times, and we can see its effect on consumers purchasing durable goods. However, we can determine that the economy was weaker in April 2020 than in November 2019 because sales in 2019 did not fall as much.
From the data, we can determine that during these times, the low demand could have led to increased unemployment and decreased GDP, especially during the drastic drop in April and its surrounding months.
Example 3: The Great Recession
We can also analyze data from The Great Recession. This recession occurred from December 2007 to June 2009, so we can look at this data and the data of the surrounding months.
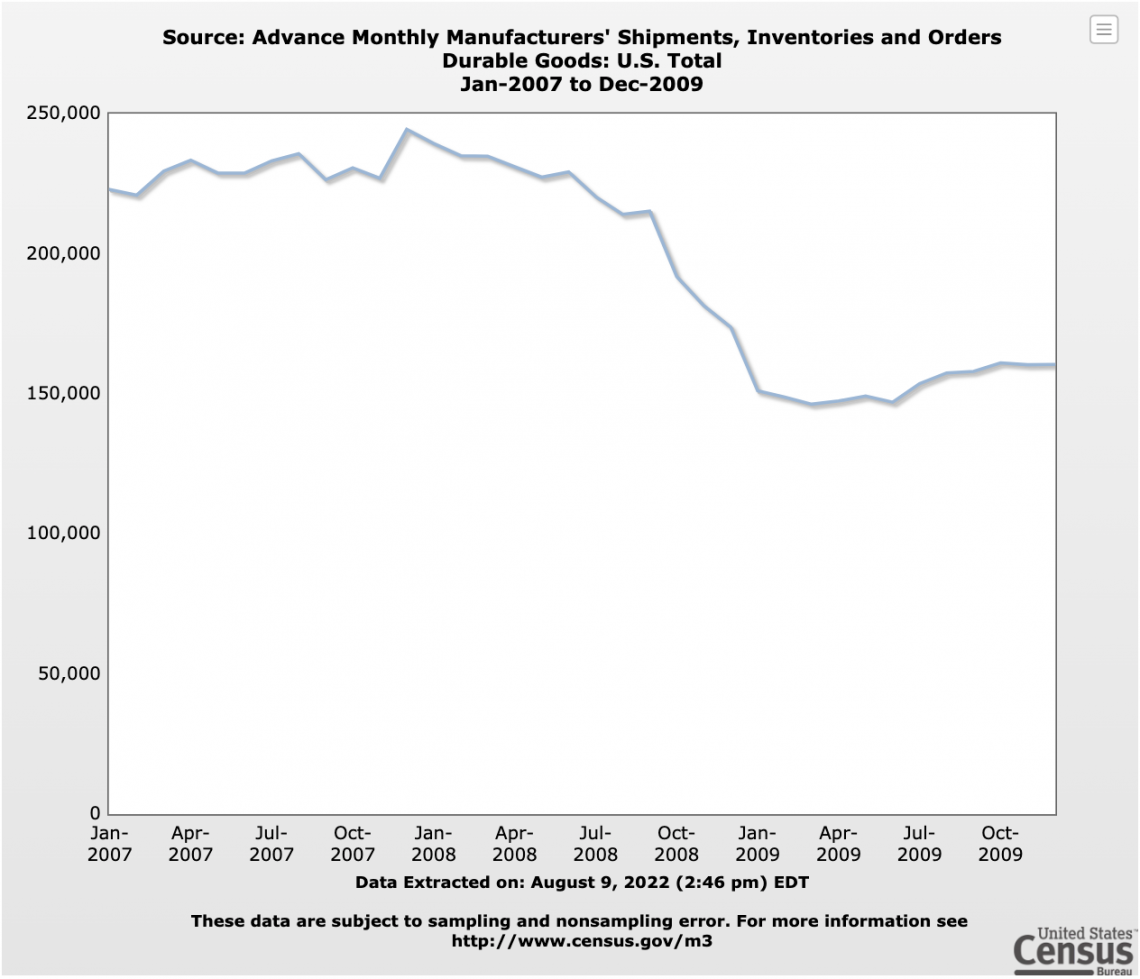
Here, we can see the same pattern as in the COVID-19 recession. However, there is one big difference between the two. The durable goods orders report returns to pre-recession levels within a few months for the COVID-19 recession but do not for the Great Recession.
It took until the end of 2011 for these sales to return to pre-recession levels. Also, for the economy as a whole, it took until the second quarter of 2011 for the economy to become healthy again.
This makes sense, as this recession was on a global scale. People and companies across the world invested in American banks and investment companies. So when the American companies lost a lot of money, their investors did too.
Because the recovery from this recession was a global recovery, it took much more time and effort to restore to prior conditions.

Free Resources
To continue learning and advancing your career, check out these additional helpful WSO resources:


or Want to Sign up with your social account?