Gini Coefficient
A metric for gauging how unequally people's or a nation's wealth is distributed.
 Yang")

What Is The Gini Coefficient?
The Gini coefficient is a numerical value utilized to gauge the level of inequality regarding a society's wealth or income.
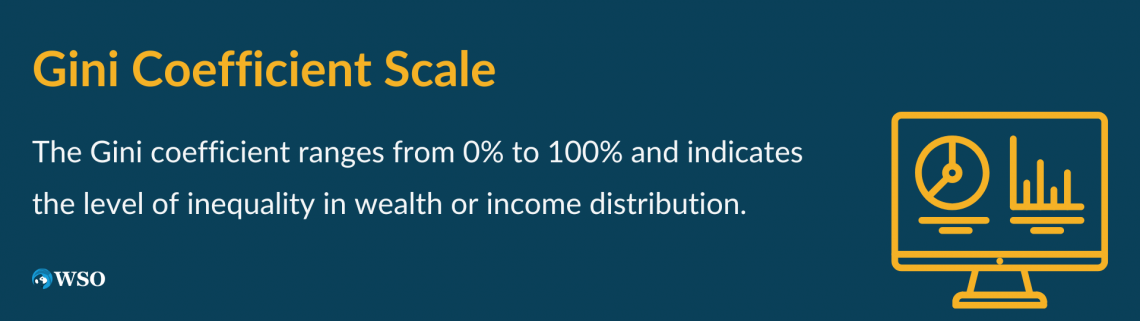
The Gini coefficient was invented by an Italian statistician and demographer named Corrado Gini, who was interested in studying how different groups of people have different shares of the total income or wealth. Sporadically, the coefficient can go from 0% to 100% (or 0 to 1).
A complete absence of inequality occurs when a Gini coefficient of 0 is present. This indicates that all individuals possess an identical amount of income or wealth.
A coefficient of 1 means that one person or group has all the income or wealth, and everyone else has nothing, so there is extreme inequality.
We analyze different groups to determine this coefficient, which helps us establish the distribution of either income or wealth.
Dividing the population into five sections can provide a better understanding. The five sections include the wealthiest 20%, the next 20%, and the poorest 20%. Then we can see what percentage of the total income or wealth each group has.
While the poorest 20% only have 5% of the income, the richest 20% control almost half of it—45%. Meanwhile, the next 20% receive only 10%.
For instance, a distribution could be established where each consecutive quintile obtains an additional percentage of income compared to the preceding quintile. A graph can display the percentages we computed.
- The Gini Coefficient is a measure of income inequality within a population. It ranges from 0 to 1, where 0 represents perfect equality and 1 represents perfect inequality.
- A low Gini Coefficient indicates more equal income distribution. For example, Scandinavian countries typically have lower Gini Coefficients.
- The high Gini Coefficient indicates more unequal income distribution. For instance, some Latin American and African countries have higher Gini Coefficients.
- Generally, developed countries tend to have lower Gini Coefficients compared to developing countries, although there are exceptions.
The Lorenz Curve Graph
Featuring two axes, this graph will showcase the cumulative percentage of people from 0% to 100% on the horizontal, while the vertical will display the cumulative percentage of wealth or income from 0% to 100%.
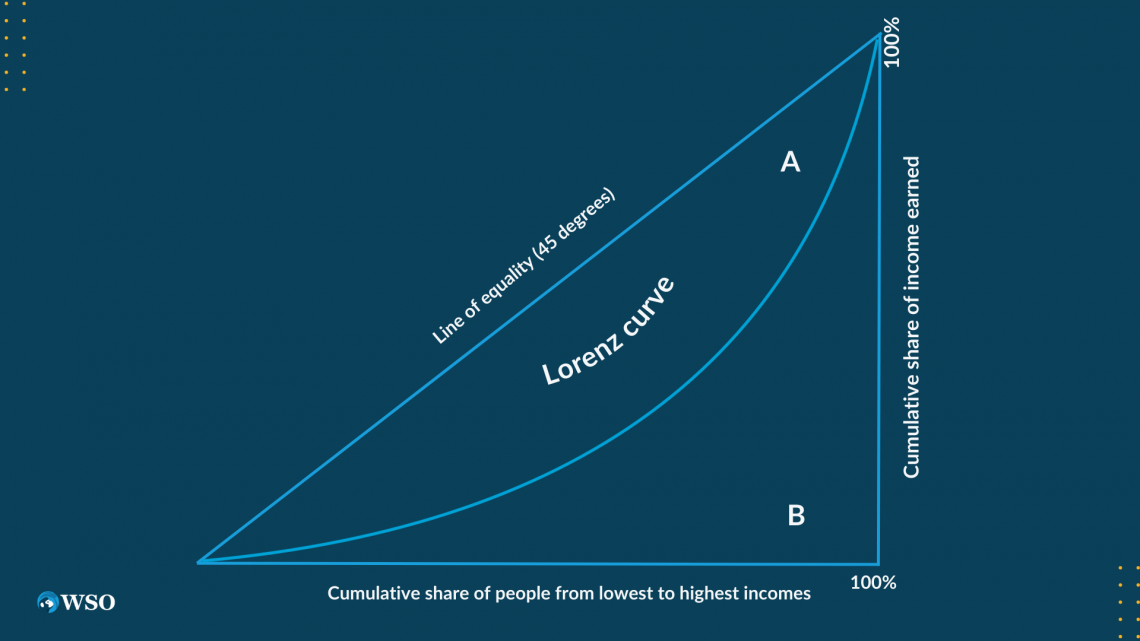
This graph, called a Lorenz curve, shows how far the actual distribution of income or wealth is from a perfectly equal distribution. Regarding equality, one would ideally see a straight line starting at (0%,0%) and ending at (100%,100%).
This line represents the idea that every group earns a proportional income and wealth as their populace. If $1,000 in total income were divided amongst 100 individuals, each would receive $10.
Additionally, each cluster of 20 individuals would see $200 allocated to them. But in reality, the Lorenz curve is usually curved below this line, meaning that some groups have less than their fair share of income or wealth, and some groups have more.
The more curved the Lorenz curve is, the more unequal the society is.

Understanding the Gini Coefficient
The Gini coefficient measures the area between the Lorenz curve and the line of perfect equality. This coefficient will be lower if the area is smaller. It's a given that if the area is increased, the coefficient will increase accordingly.

This coefficient can be calculated by dividing this area by half of the total area under the line of perfect equality. But why does it matter? It is worth noting that income and wealth are critical factors that can reveal a society's levels of equity and fairness.
Individuals' financial status can impact their well-being. It can also shape the opportunities available to them. Social problems like poverty, crime, violence, corruption, discrimination, and health issues can arise with a high coefficient, indicating a significant inequality level.
A low Gini coefficient means more equality, leading to social benefits like democracy, trust, cooperation, education, innovation, etc. Inequality cannot be perfectly measured by the Gini coefficient, naturally.
Being aware of its limitations is crucial. It doesn't account for the dynamic aspects of financial disparity among individuals—how their financial status changes through the years or from generation to generation.
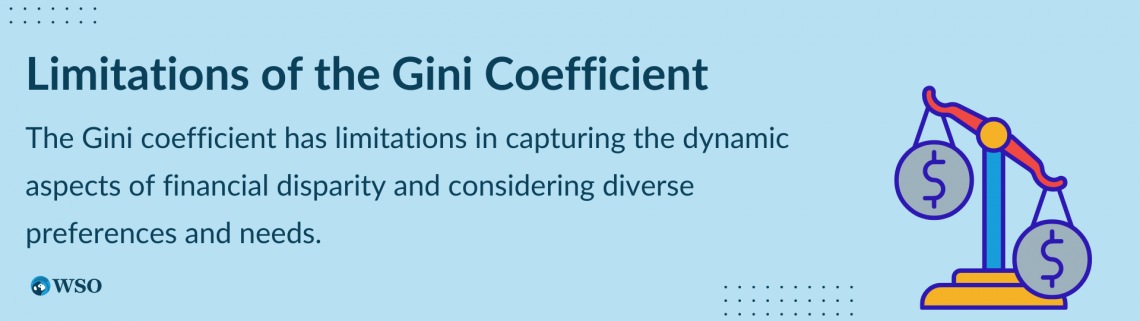
Also, income or wealth inequality is looked at in a one-dimensional manner. Depending on circumstances and culture, people's preferences and needs also vary, which is not considered by the approach. This needs to illuminate inequality's root cause and possible solutions.
Inequality comparisons among countries, regions, and groups can still be made despite the confines of the Gini coefficient's usefulness. Different economic systems can affect the everyday lives of people. This is why understanding them is crucial.
To ponder what sort of community we desire to inhabit and the principles we yearn to encourage, we need only look to it for inspiration.
Principles of the Gini Coefficient
To calculate the Gini coefficient, we need to compare the actual distribution of income or wealth with a hypothetical distribution representing perfect equality.

The Lorenz Curve
Imagine that we line up all the people in a country. This is ordered from the poorest to the richest. Then, we plot their cumulative share of income or wealth on a graph. This curve is called the Lorenz curve.
If everyone had the same income or wealth, the Lorenz curve would be a straight line at a 45-degree angle. This line is called the line of equality.
Gini Coefficient Visualized
The Gini coefficient is concerned with the Lorenz curve and the line of equality—specifically, the area between these two shapes is divided by the total area under the line of equality for calculation.
The more the Lorenz curve deviates from the line of equality, the larger the area between them and the higher the coefficient. The closer the Lorenz curve is to the line of equality, the smaller the area between them and the lower the coefficient.
Comparing Inequality
A country or group's level of inequality is perfectly captured by this coefficient, condensing this information into a solitary numeric value. It can help us compare countries or groups over time or across regions.
It can also help us understand how policies or events affect inequality.
Note
We can see how taxes, transfers, education, health, trade, migration, corruption, discrimination, etc., influence the Gini coefficient.
Implications of the Gini Coefficient
After grasping its calculation and definition, let's discuss the significance of the Gini coefficient for society.
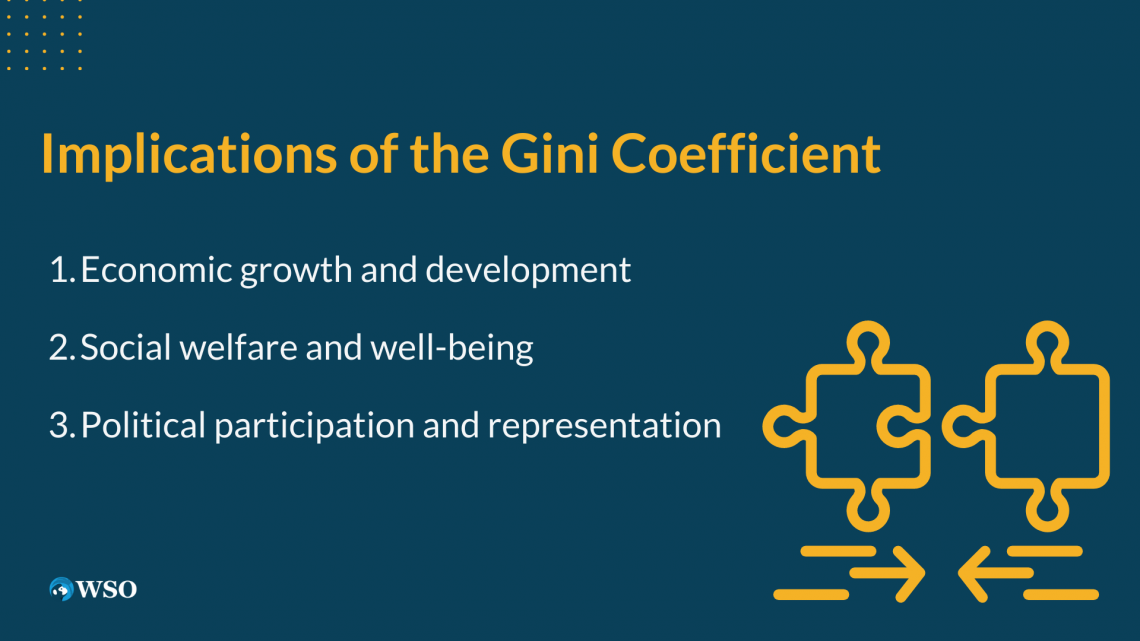
Income inequality holds relevance due to various social and economic reasons. Some of them are described below.
Economic Growth and Development
This creates inefficiencies in resource allocation and undermines social cohesion and trust. As a result, high levels of income inequality have been found to reduce economic growth and potentially discourage investment. Several studies observed these correlations.
Stimulating economic growth comes as a benefit from moderate levels of income inequality since it creates incentives for entrepreneurship, risk-taking, and human capital accumulation, as revealed by some studies.
Note
It is worth noting that income inequality can also have negative effects.
Social Welfare and Well-being
For those at the bottom of the income scale, high-income inequality increases poverty while destroying social inclusion. But those who stand at the top bring in excessive consumption, engender waste, and environmental degradation.
High levels of income inequality can hinder people's potential to improve their living standards. Opportunities for advancement may become scarce. Increased income inequality leads to the escalation of social issues such as health disparities and corruption.
Note
It also has a severe impact on ethical and social values like fairness, cooperation, and justice.
Political Participation and Representation
Creating power imbalances between societal groups and high levels of income inequality can undermine governance and democracy.
Those with less income may need more representation and voice in public affairs. In contrast, those with more income can exert more influence over political decisions and policies that impact their interests.
High levels of income inequality can also breed political apathy and alienation among citizens who feel disconnected from their governments and institutions.
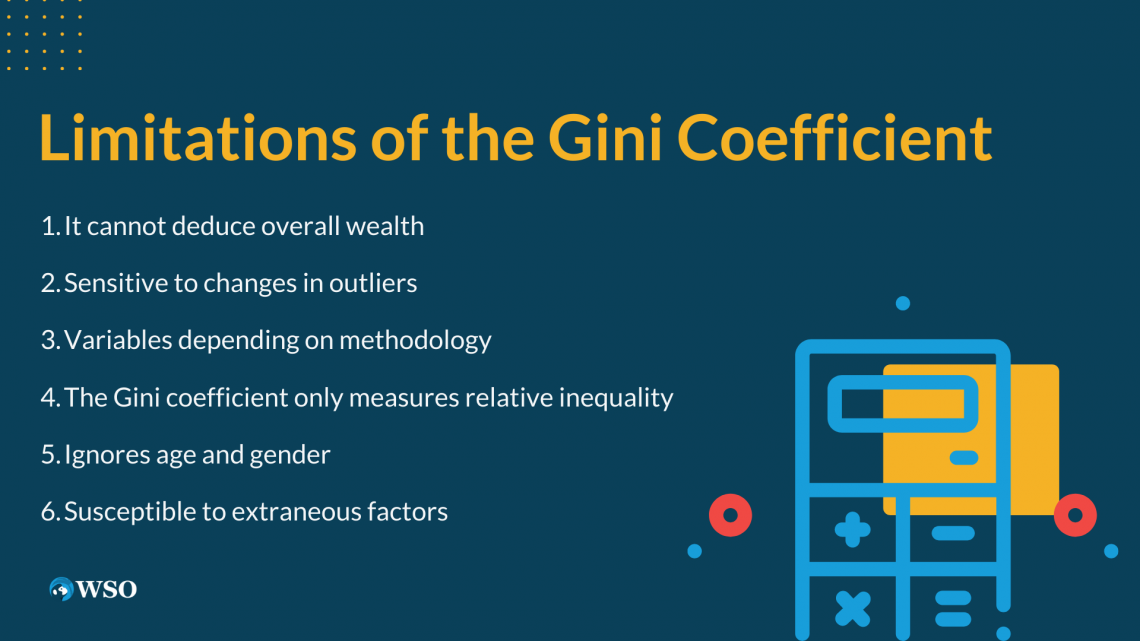
Limitations of the Gini Coefficient
As expected, the measure of inequality known as the Gini coefficient could be more flawless.
Awareness is key when it comes to limitations that are present. The limitations are described below.
It Cannot Deduce Overall Wealth
It also cannot speak to the distribution of either wealth or income among society or a subset of people.
For example, countries with the same Gini coefficient might have different average incomes or poverty rates. Similarly, two groups with the same coefficient might have very different shares of income or wealth by gender, race, age, etc.
Sensitive to Changes in Outliers
The financial status of a select few rich individuals can cause big fluctuations in this coefficient, whether their wealth increases or decreases.
Meanwhile, the majority of individuals' incomes remain relatively unchanged. Most people's incomes can remain relatively stable, yet changes in the wealth of a small segment of very impoverished or wealthy individuals will impact this coefficient.
Variables Depending on Methodology
Do we go with the income that's been taxed or not when making calculations? Do we include capital gains or transfers?
Do we use annual or monthly income? Do we use market value or net worth for wealth? These choices can affect how we calculate and interpret this coefficient.
Far from perfect, the Gini coefficient is a tool utilized to gauge inequality. It cannot tell us everything we need to know.
But it can help us get a general idea of how unequal a country is. To gain a comprehensive understanding of inequality and its origins and effects, we ought to incorporate various indicators and sources of data into our analysis.
The Gini Coefficient only Measures Relative Inequality
It does not measure absolute inequality. It only compares people's incomes or wealth to each other. An absolute measure of their wealth is not something we can determine from this.
For example, two countries could have the same coefficient but very different levels of poverty or prosperity.
Ignores Age and Gender
It doesn't communicate how different groups are treated or discriminated against or how they access opportunities and resources. For example, two countries could have the same coefficient but very different levels of gender equality or racial justice.
Susceptible to Extraneous Factors
Numerous factors can impact the coefficient. Population size, data quality, and age structure are all variables that could influence the coefficient.
That means it doesn't tell us what causes inequality or how to reduce it. For example, two countries could have the same Gini coefficient but very different policies or institutions that affect inequality.
Using this as a starting point, different countries or groups can be compared to understand inequality. But we shouldn't rely on it alone. We should also look at other indicators and sources of information that can give us a more complete and nuanced picture of inequality.
By no means perfect, the Gini coefficient remains an incredibly useful measure. This variable has some limitations, as shown later in this article.
In addition to using other indicators, you can improve your understanding of a country's financial situation by reading up on material and putting it into context.


Free Resources
To continue learning and advancing your career, check out these additional helpful WSO resources:


or Want to Sign up with your social account?