Horizontal Analysis
Evaluation of an organization's financial performance over many reporting periods


What is Horizontal Analysis?
Horizontal analysis is the evaluation of an organization's financial performance over many reporting periods. Side by side they do this to determine if the company's performance is improving or declining.
The goal is to find significant changes in the data. Later, this data could be used to conduct a more in-depth examination of financial performance.
The analysis is usually just a basic grouping of data ordered by period, but the numbers in each consecutive period can also be stated as a percentage of the amount in the baseline year, with the baseline amount indicated as 100%.
Internal corporate management and investors frequently use the analysis. Individuals who wish to invest in a company must decide whether to sell their present shares or purchase more.
When it comes to management, it determines the actions to take in order to improve the future performance of the firm. In general, the method aids in understanding a company's performance so that educated decisions may be made.
On its own, a horizontal analysis comparison is a helpful tool. However, an extra vertical analysis approach is required for management and innovators to make better-informed judgments.
Now we are going to explain what Financial Analysis is in general, so we can understand more about this specific type of analysis.
- Horizontal analysis evaluates financial performance over multiple reporting periods to identify trends and determine if a company's performance is improving or declining.
- Used primarily by internal corporate management and investors, horizontal analysis aids in making informed decisions about selling or purchasing company shares, and in shaping future company strategies.
- While horizontal analysis examines data across multiple periods, vertical analysis focuses on data within a single period, comparing figures to a base figure, typically total revenues or total assets.
- Horizontal analysis allows for easy visual identification of trends and deviations, but it can sometimes present skewed results due to changes in account structures or intentional manipulation of comparison periods.
Formulas for horizontal analysis
To perform this analysis on the income statement or the balance sheet, we must first compare the financial results, that is, the change in line items from one accounting period to the next, in order to determine whether the change is positive or negative, and how strong the growth or decline is.
In other words, it shows the change in each line item, either in absolute terms or as a percentage change year over year (Y-o-Y).
Horizontal Analysis= Amount in Comparison Year – Amount in Base Year
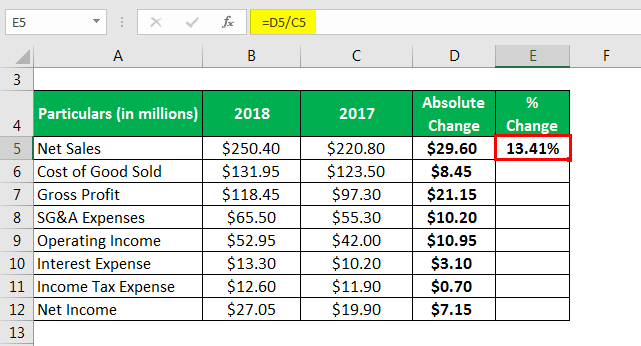
This specific analysis (percent change) formula is calculated by dividing the difference between the amount in the comparison year and the amount in the base year in the base year. It is expressed mathematically as:
Horizontal Analysis (%) = [(Amount in Comparison Year – Amount in Base Year) / Amount in Base Year] * 100
These formulas are used to compare trends across time, which might be quarter-to-quarter or year-to-year, depending on the accounting period from which the data is derived.
To acquire relevant insights into how a firm is operating, it's important to use several years of historical data for this analysis. This can assist in determining what is a definite pattern and what is a one-time occurrence.
advantages and Disadvantages of Horizontal Analysis
It's best to do so for all of the financial statements at once so you can understand the full influence of operational outcomes on a company's financial situation across the review period.
For example, the income statement analysis in the two instances below shows a company having a great second year, but the accompanying balance sheet analysis reveals that it is having problems supporting growth due to a decrease in cash, a rise in accounts payable, and an increase in debt.
It incorporates computations of key ratios or margins, such as the current ratio, interest coverage ratio, gross margin, and/or net profit margin, which can be highly insightful.
Take note of any measurements contained in a company's loan covenants, as it's important to keep an eye on changes in these numbers that could lead to a covenant breach.
1. Advantages
This type of analysis has the advantage of allowing for the visual identification of anomalies from long-term trends.
-
Changes in the data are more easily visible when presented on a comparative basis.
-
The ability to compare trends to those of competitors or industry averages to assess how well an organization's performance compares to that of others.
-
Detecting anomalies in a trend needs little talent, whereas determining if the data in a presentation are suggestive of problems may require extensive knowledge.
2. Disadvantages
-
The aggregation of information in financial statements may have changed over time due to ongoing changes in the chart of accounts, causing revenues, expenses, assets, or liabilities to shift between different accounts and appear to cause variances when comparing account balances from one period to the next.
-
This examination can be used to report results that are skewed. This can occur when the analyst alters the number of comparison periods utilized to make the results appear exceptionally excellent or unfavorable.
-
This problem can be mitigated by using comparison periods consistently. Also, any changes in the comparison periods should be reported when an analysis is presented on a repeating basis over numerous reporting periods so that readers are aware of the difference.
How to perform horizontal analysis?
It can be performed in the following ways:
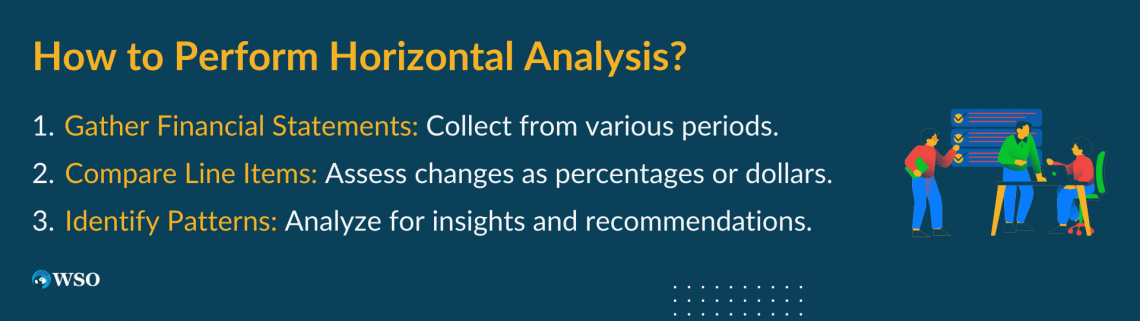
1. Gather financial statements
Begin by accumulating financial statements from different quarters or years, as horizontal analysis is performed on financial statements throughout time.
2. Compare the statements
Choose which line items to examine after you've gathered your assertions. To assess how the amounts have changed over time, compare the identical line items from successive statements and represent the changes as percentages or dollar amounts.
3. Patterns and trends in the data should be identified
Analyze the information to determine if there are any difficulties or opportunities for the company. This might aid the company in generating effective projects and planning for the future. You can also provide recommendations to the firm based on your findings.
Horizontal Analysis of the Income Statement
Horizontal income statement analysis is typically done in a two-year manner, as shown below, with a variance that shows the difference between the two years for each line item.
Another option is to simply add as many years as would fit on the screen without presenting a variance, allowing you to monitor overall changes by account over time.
| 2017 (Base Year) | 2018 | Change ($) | Change (%) | |
|---|---|---|---|---|
| Revenue | 100,000 | 130,000 | 30,000 | 30% |
| Cost of Goods Sold | 32,000 | 42,000 | 10,000 | 31% |
| Gross Profit | 68,000 | 88,000 | 20,000 | 29% |
| Administrative | 1,000 | 1,240 | 240 | 24% |
| Sales & Marketing | 500 | 1,000 | 500 | 100% |
| Operating Expenses | 66,500 | 85,760 | 19,260 | 29% |
| Depreciation | 100 | 220 | 120 | 120% |
| Operating Income | 66,400 | 85,540 | 19,140 | 29% |
| Interest Expense | 500 | 700 | 200 | 40% |
| Income Before Taxes | 65,900 | 84,840 | 18,940 | 29% |
| Income Tax Expense | 2,000 | 2600 | 600 | 30% |
| Net Income | 63,900 | 82,240 | 18,340 | 29% |
Horizontal Analysis of the Balance Sheet
This type of analysis in the balance sheet is typically done in a two-year manner, as illustrated below, with a variance indicating the difference between the two years for each line item.
Another option is to add as many years as would fit on the page without providing a variance, allowing you to view overall changes by account over time.
For example, if management determines that increased earnings per share are due to an increase in revenue or a drop in the cost of goods sold (COGS), the horizontal analysis can corroborate.
It can assess whether sufficient liquidity can service the company using indicators such as the cash flow to debt ratio, coverage ratios, interest coverage ratio, and other financial ratios.
| Liabilities and Stockholders' Equity | 2020 | 2019 | Change ($) | Change (%) |
|---|---|---|---|---|
| Current Liabilities | $ | $ | $ | % |
| Notes Payable | 50000 | 43000 | 7000 | 16% |
| Current Obligation under capital leases | 78000 | 65000 | 13000 | 20% |
| Accounts Payable | 1400000 | 1289000 | 111000 | 9% |
| Accrued Salaries and wages | 40000 | 29000 | 11000 | 38% |
| Income Taxes Payable | 20000 | 34750 | -14750 | -42% |
| Total Current Liabilities | 1588000 | 1460750 | 127250 | 9% |
| Long-term Debt | ||||
| Obligation under capital leases | 750000 | 765000 | -15000 | -2% |
| Notes and debentures | 500000 | 422000 | 78000 | 18% |
| Total Long-term Debt | 1250000 | 1187000 | 63000 | 5% |
| Accrued claims and other liabilities | 115000 | 96000 | 19000 | 20% |
| Total Liabilities | 4203000 | 3930750 | 272250 | 7% |
| Stockholders' Equity | ||||
| Common Stock | 99000 | 97000 | 2000 | 2% |
| Additional Paid-in Capital | 246000 | 26000 | 12% | |
| Cumulative translation adjustment | -155000 | 1200 | 36% | |
| Retained Earnings | 1280000 | 9% | ||
| Total Stockholders' Equity | 1470000 | 1373000 | 97000 | 7% |
| Total Liabilities and Stockholders' Equity | 5673000 | 5303750 | 369250 | 7% |
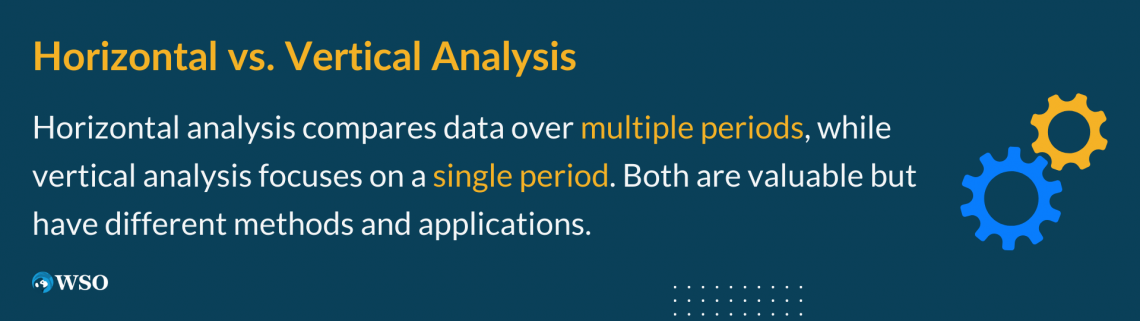
Horizontal Analysis vs. Vertical Analysis
The major distinction between horizontal and vertical analysis is that horizontal analysis compares numbers from multiple reporting periods, whereas vertical analysis compares figures from a single reporting period. The more data available, the easier it is to spot trends.
Horizontal analysis of the cost of insurance, for example, may show the cost on a quarter for the previous few years, but a vertical analysis would just show the cost as a % of sales for the current time.
Creditors and investors use vertical analysis to compare a company's financial performance to that of others in the same industry.
Both tools offer invaluable insights, but their methods and focuses differ considerably. Below, we show the distinctions between these two analysis.
| Horizontal Analysis | Vertical Analysis | |
|---|---|---|
| Definition | Analysis of financial data over a period, allowing for trend identification. | Analysis of a financial statement, where each item is a percentage of a base figure, usually total revenues or total assets. |
| Focus | Time series: reviews financial data across multiple periods. | Individual financial statement: studies each item in relation to a main figure within a single period. |
| Application | Used to gauge performance over time and identify cyclic patterns. | Useful for understanding the composition of financial statements in a given period and comparing it to industry standards. |
| Objective | Determining growth, consistency, and volatility over time. | Assessing the proportionality and structure of financial statement items. |
| Primary Users | Investors seeking to understand long-term performance. | Managers assessing resource allocation or investors comparing company structure to industry benchmarks. |
| Example | Observing revenue growth over a five-year period. | Evaluating how much of every dollar in sales is used toward the cost of goods sold in a particular year. |
It becomes evident that horizontal analysis serves as a temporal lens, allowing us to traverse the financial journey of an entity over multiple periods.
On the other hand, vertical analysis offers a snapshot, a deep dive into the structural composition of financial statements at a particular moment.
While both methodologies have their unique virtues, for those aiming to understand the evolutionary financial narrative of an organization, horizontal analysis undoubtedly stands out as the methodology of choice.¿
Skills for a Financial Analyst
You should be a financial analyst to perform horizontal or vertical analysis of financial statements.

But what exactly are the top 3 skills for a financial analyst? Regardless of education, a successful career as a financial analyst requires:
1. Strong quantitative skills
A quantitative skill is defined as any skill that includes the use or manipulation of numbers. It's the capacity to think in numbers. Quantitative abilities are essential in statistics, economics, and mathematics, for example, although quantitative techniques are employed across the board.
2. Expert problem-solving abilities
Problem-solving abilities enable you to determine why something is occurring and how to resolve it. It's one of the most significant skills that employers look for in potential employees. The issue-solving process includes identifying the problem, generating solutions, implementing those solutions, and evaluating their effectiveness.
3. Problem-solving abilities
Problem-solving abilities relate to the capacity to solve difficulties in an efficient and timely manner without encountering any hurdles. It comprises recognizing and describing the problem, developing several solutions, assessing and selecting the best option, and implementing the chosen solution.


Researched and authored by Charbel Yammine | LinkedIn
Free Resources
To continue learning and advancing your career, check out these additional helpful WSO resources:


or Want to Sign up with your social account?