Vertical Analysis
Vertical analysis is comparing items on a financial statement as percentages of a base item. It helps assess proportions and trends within the same statement


What Is Vertical Analysis?
Vertical analysis is the process of converting separate data into percentages on a common foundation. The percentage of each component illustrates how it relates to the overall.
It is a sort of analysis in which each accounting variable is examined vertically. This type of statement is also called Common Size Statements. They may be prepared for the balance sheet as well as the profit and loss statement.
Financial statements show the absolute values of an organization's assets, liabilities, revenues, costs, and profit or loss. However, they do not directly offer the company's earning capability, liquidity, or financial stability, which makes them difficult for users to read.
As a result, financial statements are thoroughly evaluated to display them clearly and intelligibly. The following are various accounting tools used to analyze these financial statements:
- Comparative Statements or Horizontal Analysis
- Common Size Statements or Vertical Analysis
- Trend Analysis
- Cash Flow Statement
- Ratio Analysis
- Break-Even Point Analysis
Vertical Analysis is a proportional evaluation of a financial statement in which each line item is given as a percentage of another line item.
It comprises the following:
- Absolute amounts of specific items on the Statement of Profit and Loss and the Balance Sheet for two or more successful periods are expressed as a percentage of a common base.
- Typically, the total revenue from operations is used as a base for the Statement of Profit and Loss, and the total of assets or equity & liabilities is used as a foundation for the Balance Sheet items.
This implies that each line item is expressed as a percentage of gross sales on an income statement, but on a balance sheet, each line item is expressed as a percentage of total assets.
- Vertical analysis converts financial data into percentages, allowing a comparison of each component's significance within the whole. It's a common size analysis used for both balance sheets and income statements.
- Vertical analysis is one of several tools used to analyze financial statements, alongside horizontal analysis, trend analysis, ratio analysis, and others. It provides a proportional evaluation of each line item.
- Vertical analysis establishes relationships, aids comparison across organizations, identifies trends, and assists decision-making. It helps discern patterns and anomalies, contributing to strategic planning.
Purpose of Vertical Analysis
Let us take a look at the purpose of the analysis:
1. Establish a relationship
As various items on the balance sheet (or the income statement) are expressed as a percentage of the total of the balance sheet (or the revenue from operations), over time, a relationship gets established between them. This helps in drawing significant conclusions.
For example, over the years, it has been established that the cost of raw materials for an organization is 35-40% of the revenue from operations; an increase in this percentage range will need immediate attention.
2. Providing a common base for comparison
The key benefit of vertical financial statement analysis is that it allows you to compare income statements and balance sheets from organizations of various sizes.
Financial statements of different organizations, when expressed as a percentage to a common base, makes them easier to compare them irrespective of their sizes.
Comparing the exact numbers of organizations of various sizes does not yield helpful information about their financial position.
3. Identify trends
The information gathered from a vertical analysis of the financial statements can be used to compare specific accounting periods, making it easier to identify trends in the accounting books and any increase or fall that may have occurred over time.
4. Aid in decision-making
It may also be used to discover business processes with unusually high costs or returns and then utilize that information to make judgments regarding your company's future course.
Lastly, a company's aims and objectives will determine how vertical analysis is applied to the books of accounts.
Comparative Balance Sheet with Vertical Analysis
A common-size balance sheet is also a balance sheet containing figures from two (or more) accounting periods to which the vertical analysis has been applied.
It consists of five columns:
- Column 1: Items of Balance Sheet
- Column 2: Amounts of different items of assets and equities & liabilities on the current year's balance sheet.
- Column 3: Amounts of different items of assets and equities & liabilities on the previous year's balance sheet or from another year to be compared.
- Column 4: The percentage of different items of assets and, equities & liabilities on the current year's balance sheet to the same year's total assets or liabilities, which is taken as 100.
- Column 5: The percentage of different items of assets and equities & liabilities on the previous year's balance sheet to that year's total assets or liabilities, which is taken as 100.
Common Size Balance Sheet
As at _________________________
| Particulars | Absolute Amounts ($) | Percentage of Balance Sheet Total (%) | ||
|---|---|---|---|---|
| Current Year | Previous Year | Current Year | Previous Year | |
| I. ASSETS: | ||||
| i) Non-Current Assets | xx | xx | x | x |
| ii) Current Assets | xx | xx | x | x |
| Total Assets | xxx | xxx | 100 | 100 |
| II. LIABILITIES & OWNER'S EQUITY: | ||||
|
||||
| i) Non-Current Liabilities | xx | xx | x | x |
| ii) Current Liabilities | xx | xx | x | x |
|
||||
| i) Share Capital | xx | xx | x | x |
| ii) Reserve & Surplus | xx | xx | x | x |
| Total Liabilities & Owner's Equity | xxx | xxx | 100 | 100 |
Comparative Balance Sheet with Vertical Analysis Example
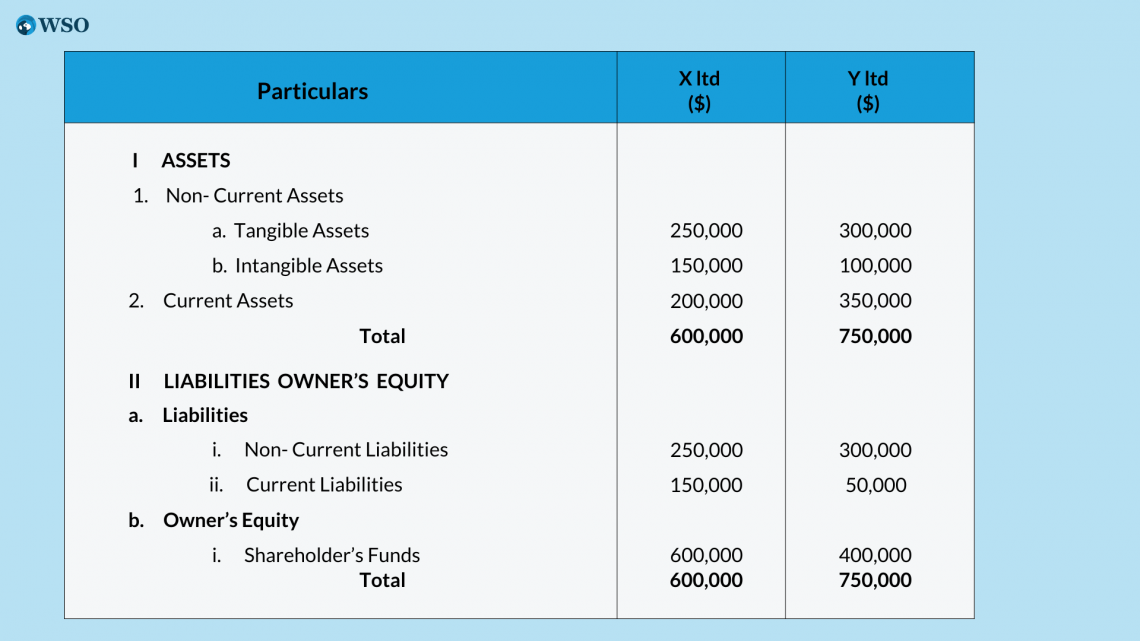
Below are the balance sheets of X Ltd and Y Ltd as of 31st December 2021. Apply vertical analysis and comment on their financial positions.
Balance Sheet
The solution is below:
Balance Sheet of X Ltd. and Y Ltd.
As of 31st December 2021
| Particulars | Absolute Amounts ($) | Percentage of Balance Sheet Total (%) | ||
|---|---|---|---|---|
| X ltd. | Y ltd. | X ltd. | Y ltd. | |
| I. ASSETS: | ||||
| i) Non-Current Assets | ||||
|
250,000 | 300,000 | 41.67 | 40 |
|
150,000 | 100,000 | 25 | 13.33 |
| ii) Current Assets | 200,000 | 350,000 | 33.33 | 46.67 |
| Total Assets | 600,000 | 750,000 | 100 | 100 |
| II. LIABILITIES & OWNER'S EQUITY: | ||||
|
||||
| i) Non-Current Liabilities | 200,000 | 300,000 | 33.33 | 40 |
| ii) Current Liabilities | 100,000 | 50,000 | 16.67 | 6.67 |
|
||||
| i) Shareholder's Funds | 300,000 | 400,000 | 50 | 53.33 |
| Total Liabilities & Owner's Equity | 600,000 | 750,000 | 100 | 100 |
Comments: Based on the above common-size balance sheet of X Ltd. and Y Ltd., the following differences can be observed in their financial positions:
1. The short-term financial position of Y Ltd. is better when compared to X Ltd. The current liabilities of Y Ltd. are 6.67% of the total funds invested, whereas the proportion of current assets in these firms is 46.67%.
On the other hand, the current liabilities of X Ltd. are 16.67% of total funds, while the current assets are 33.33% of these funds. Thus, trade payables are more secured in Y Ltd.
2. Like the short-term financial position, the financial position in the long term of Y Ltd. is also better when compared to X Ltd.
The shareholder's funds, as seen in the common-size balance sheet, are 53.33% of the total funds for Y Ltd., whereas, in the case of X Ltd. is 50% only.
3. Non-current liabilities, X Ltd. and Y Ltd (33.33% and 40%, respectively), are less than the shareholder's funds (50% and 53.33%, respectively).
It shows that both firms have sufficient protection from long-term lenders.
4. Investment in non-current assets can be seen more in X Ltd. (66.67%) as compared to Y Ltd (53.33%).
Comparative Income Statement with Vertical Analysis
A common-size statement of profit & loss is a statement in which the figure revenue from operations is taken as the common base, and all other items in the statement are expressed as a percentage. It is a vertical analysis applied statement of profit & loss.
It also has five columns:
- Column 1: Items of Statement of Profit & Loss.
- Column 2: Amounts of different items, i.e., income or expenses on the statement of profit & loss of the current year.
- Column 3: Amounts of different items, i.e., income or expenses on the statement of profit & loss of the previous year or from another year to be compared.
- Column 4: The percentage of different items of the statement of profit & loss of the current year to the same year's revenue from operations is taken as 100.
- Column 5: The percentage of different items of the statement of profit & loss of the previous year to that year's revenue from operations is taken as 100.
Common Size Statement of Profit & Loss
For the year ended on ___________________________
| Particulars | Absolute Amounts ($) | Percentage of Balance Sheet Total (%) | ||
|---|---|---|---|---|
| Current Year | Previous Year | Current Year | Previous Year | |
|
I. Revenue from Operations |
xxx | xxx | 100 | 100 |
|
II. Add: Other Incomes |
xx | xx | x | x |
|
III. Total Revenue (I+II) |
xx | xx | x | x |
|
IV. Less: Expenses: |
||||
| Cost of Materials Consumed | xx | xx | x | x |
| Purchase of Stock | xx | xx | x | x |
| Changes in Inventory of | ||||
|
xx |
xx |
x |
x |
|
xx | xx | x | x |
| Depreciation | xx | xx | x | x |
| Other Expenses | xx | xx | x | x |
| Total Expenses | xxx | xxx | xx | xx |
|
V. Profit before Tax (III-IV) |
xxx | xxx | x | x |
|
VI. Less: Tax |
(xx) | (xx) | (x) | (x) |
|
VII. Profit after Tax (V - VI) |
xxx | xxx | x | x |
Comparative Income Statement with Vertical Analysis Example
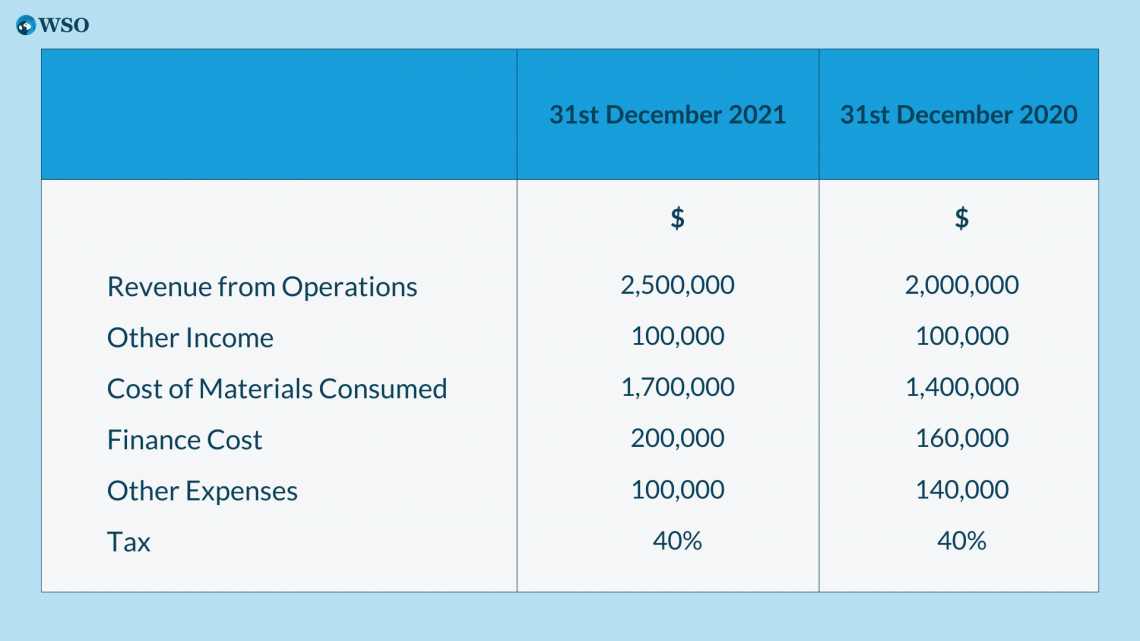
Apply vertical analysis of the given Statement of Profit & Loss of ABC Ltd. and interpret the same.
ABC Ltd.
Statement of Profit & Loss
For the year ended on 31st December 2021, and 31st December 2020
Solution for the above example is:
ABC Ltd.
Common-Size Statement of Profit & Loss
For the year ended on 31st December 2021, and 31st December 2020
| Particulars | Absolute Amounts ($) | Percentage of Balance Sheet Total (%) | ||
|---|---|---|---|---|
| 31st December 2021 | 31st December 2020 | 31st December 2021 | 31st December 2020 | |
|
I. Revenue from Operations |
2,500,000 | 2,000,000 | 100 | 100 |
|
II. Add: Other Incomes |
100,000 |
100,000 |
4 |
5 |
|
III. Total Revenue (I+II) |
2,600,000 |
2,100,000 |
104 |
105 |
|
IV. Less: Expenses: |
||||
| Cost of Materials Consumed | 1,700,000 | 1,400,000 | 68 | 70 |
| Finance Cost | 200,000 | 160,000 | 8 | 8 |
| Other Expenses | 100,000 | 140,000 | 4 | 7 |
| Total Expenses | 2,000,000 | 1,700,000 | 80 | 85 |
|
V. Profit before Tax(III-IV) |
600,000 | 400,000 | 24 | 20 |
|
VI. Tax @ 40% |
240,000 | 160,000 | 9.6 | 8 |
|
VII. Profit after Tax |
360,000 | 240,000 | 14.4 | 12 |
Interpretation: The above analysis reveals the following:
- The cost of materials consumed has reduced by 2% in the year ending on 31st December 2021 due to a reduction in the cost of raw materials.
- Total expenses have decreased from 85% to 80% in the year ending 31st December 2021. As a result, profit before tax has increased from 20% to 24%, and profit after tax increased from 12% to 14.4% in 2021.
- It may be concluded that the company worked more efficiently in 2021 compared to 2020.
Conclusion
Vertical analysis is the process of converting separate data into percentages on a common foundation. The percentage of each component illustrates how it relates to the overall.
This type of statement is also called Common Size Statements.
A common-size balance sheet is also a balance sheet containing figures from two (or more) accounting periods to which the vertical analysis has been applied.
A common-size statement of profit & loss is a statement in which the figure revenue from operations is taken as the common base, and all other items in the statement are expressed as a percentage. It is a vertical analysis applied statement of profit & loss.
It can be used for the following:
- To establish a relationship and draw significant conclusions.
- To provide a common base for comparison.
- To identify trends.
- To aid in the decision-making process of the organization.

Researched and authored by Aqsa Wasif | LinkedIn
Free Resources
To continue learning and advancing your career, check out these additional helpful WSO resources:


or Want to Sign up with your social account?