Profit and Loss (P&L)
Allow investors to measure not just the efficiency of the company, but also its performance


What is Profit and Loss (P&L)?
Profit and Loss are two financial terms that are very common in the world of finance and business and hence are useful to understand, as it allow investors to measure not just the efficiency of the company but also its performance.
There are many use cases of profit and loss for further understanding of a business’s activities, such as the creation of a Profit and Loss Statement (also known as an income statement), determining a company’s profit and loss ratio, or understanding how well a certain trading strategy is at generating profits versus losses in trading.
Profit is the amount of money that a company generates from conducting its business activities. There are two types of profit; Gross and Net Profit (also known as net income).
- Profit and Loss are essential financial terms in finance and business, allowing investors to assess a company's performance and efficiency.
- Gross profit measures revenue minus the cost of goods sold, showing how well a company produces and sells its goods.
- Net profit represents the actual profit after deducting all expenses, giving investors insight into a company's overall income.
- The Profit/Loss ratio is crucial in trading, indicating the strategy's ability to generate profits over losses, but it has limitations.
- Average Profitability Per Trade (APPT) provides a more accurate assessment of trading performance by considering the probability of winning and losing trades.
Understanding Gross Profit
Gross profit refers to the portion of revenue available after subtracting the cost of production, also known as the Cost of Goods Sold.
The formula to calculate gross profit is:
Gross Profit = Revenue - COGS
Gross profit is useful to investors as it allows them to understand how efficiently the business produces and sells its goods and services.
The gross profit margin is a formula that uses gross profit and revenue to help companies understand how much of their revenue equates to gross profit. The higher the gross profit margin is, the more efficient and profitable the business is at production.
The formula for the gross profit margin is:
Gross Profit Margin = ( Revenue - COGS ) / Revenue
or
Gross Profit Margin = Gross Profit / Revenue
Let us illustrate this with an example.
Example of Gross Profit
Monkey Inc is a company that is focused on creating devices that peel bananas by themselves. In 2020, they reported $2,400,000 in revenue by selling 100,000 units of their devices from an inventory of 120,000 units. It costs them $6 to produce each of their banana peeling devices.
In order to determine gross profit, we must determine revenue and COGS. Revenue is reported at $2,400,000. COGS, on the other hand, is not given outright. The question tells us COGS is $6 per unit, selling 100,000 units but having a total inventory of 120,000 units.
Although in 2020 they had a total inventory of 120,000, COGS is only concerned with the units they actually sold, which turns out to be 100,000 units.
Therefore, COGS = 100,000 x $6 = $600,000. Therefore, Gross Profit = $2,400,000 - $600,000 = $1,800,000. Now that we have gross profit, we can also determine Monkey Inc’s total gross profit margin.
Gross Profit Margin = ( $1,800,000 / $2,400,000 ) = 75%
A gross profit margin of 75% is a really good indicator for the management and investors, as it shows them that for each dollar they make on revenue, they receive 75 cents, with only 25 cents in production costs.
What is Net Profit?
Net profit, or net income, refers to the actual realized profit a company makes after deducting all expenses of the company.
The formula for net profit is:
Net Profit = Gross Profit - Expenses
Or
Net Profit = Revenue - COGS - Expenses
Investors are interested in a company’s net profit value as it shows them how much income the business is generating after considering all aspects of the company.
Also, the net profit margin is used in conjunction with net profit as it shows the proportion of how much a company’s revenue will actually result in profit available to owners of the company. The formula to calculate net profit margin is given as:
Net Profit Margin = Net Profit / Revenue
Let us illustrate the concept of net profit with an example.
Example of Net Profit
Monkey Inc. has been operating since 2018. In 2019, they reported a revenue of $1,000,000 and sold 42,000 units. However, as they were just starting out, they had a cost of production of $12 per unit sold in 2019. They reported $350,000 in expenses. In order to determine net profit, we must first calculate gross profit.
We know that Revenue is $1,000,000 and COGS is $12 x 42,000 = $504,000. Therefore:
Gross Profit = $1,000, 000 - $504,000 = $498,000
And as expenses were $350,000, we can calculate net profit through the formula.
Net Profit = $498,000 - $350,000 = $148,000
Now that we have net profit, we can also determine the net profit margin.
Net Profit Margin = ( $148,000 / $1,000,000 ) = 14.8%
A net profit margin of 14.8% is a relatively positive indicator for investors, as it indicates that for every $1 made in revenue, the amount the company will generate a profit of 14.8 cents.
Now that we have gone through the basics of profit means, we can focus on the term ‘loss’.
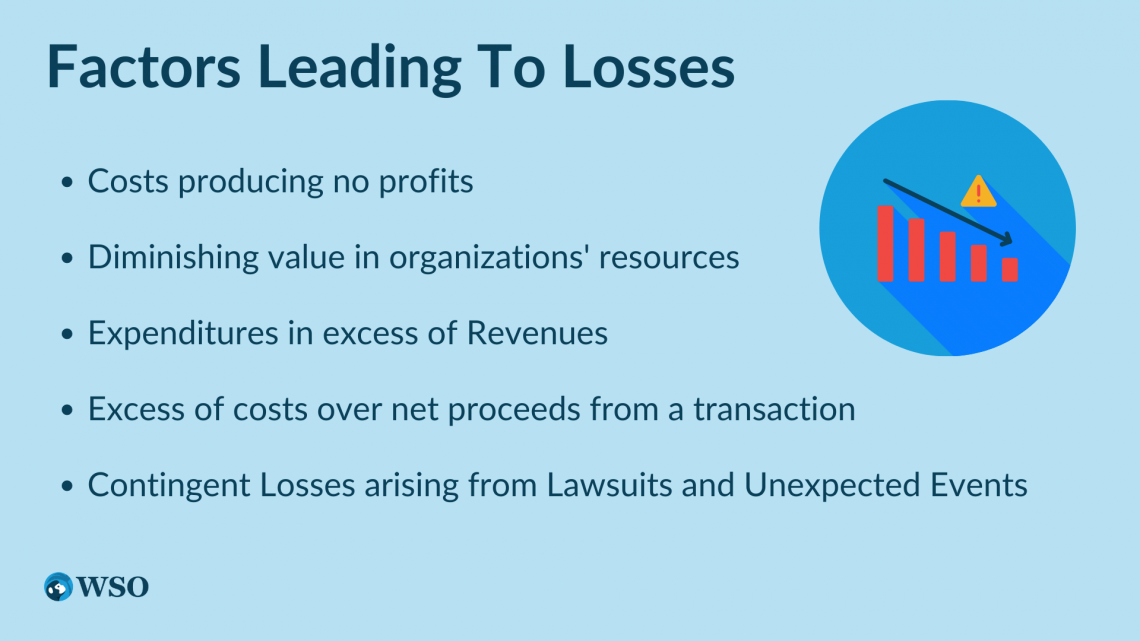
What is a Loss in business?
Loss refers to the costs incurred by a business in its aim to generate revenue. However, it can also be used when expenses exceed revenues for a particular period, resulting in net loss.
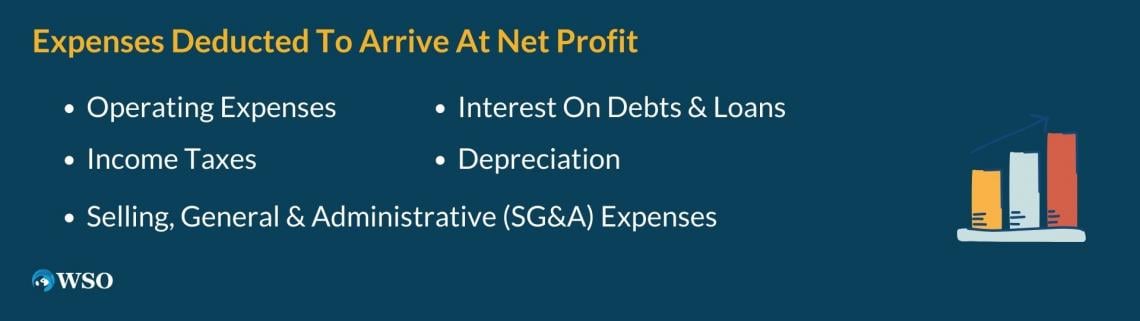
There are many types of expenses, which are all included in a company’s income statement, including operating expenses, financial expenses, losses as expenses, and COGS.
Operating expenses (OPEX) refer to the costs a company incurs for the ongoing operations of their business that are not included in COGS.
These include Selling, General and Administrative expenses (SG&A). Selling expenses refer to all sales-related expenses, such as logistics and marketing.
General and administrative expenses include the overhead expenses that cover the entire business, including:
- Rent
- Utilities
- Insurance
- Rent
- Wages
Losses as an expense include the losses a business makes, such as a lawsuit and company fines. Financial expenses include costs incurred from borrowing, such as interest accrued from outstanding debt.
Now that we covered the basics of profit and loss, we can now move on to what an income statement is and what the profit and loss ratio is.
The Income Statement Explained: Comprehensive guide
The income statement, also known as the Profit and Loss statement, is one of the financial statements a company is required to file to the Securities and Exchange Commission (SEC), outlining a company’s revenue, expenses, profits, and losses.
The statement is useful to investors as it indicates financial performance over a period of time, determining the ability of the company to generate profits. Here is an example of a typical income statement:
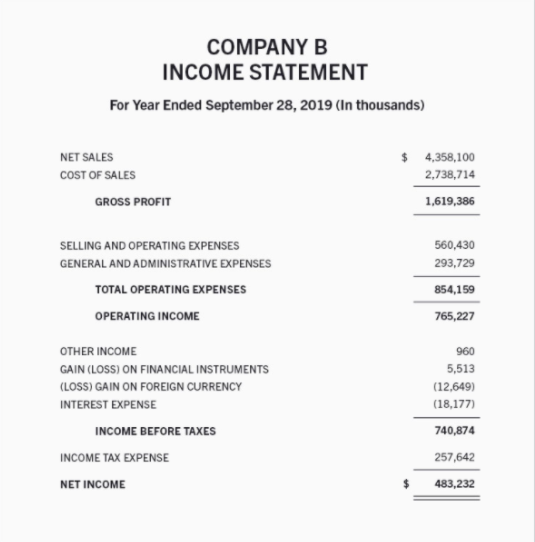
A typical income statement would start off with the company name, as well as the period for which it covers. Although some companies use slight variations in naming and structuring their income statement, most generally, it starts off with sales, COGS, and then gross profit.
After this, it usually has all operating expenses of the company, leading to the total operating income of the business (income after deducting all operating expenses) After these details, it would account for any other gains or losses the company might have made, along with the figure for Earnings Before Interest and Tax (EBIT).
After this, the interest expense would be deducted to arrive at the figure for Earnings Before Tax (EBT). Finally, the income statement would have the income tax expense, followed by the final net income, or net profit, of the business.
Mastering The Profit/Loss Ratio
The Profit/Loss ratio is a common term used in trading to monitor a strategy or a system’s abilities to generate profits over losses through trades over a period of time.
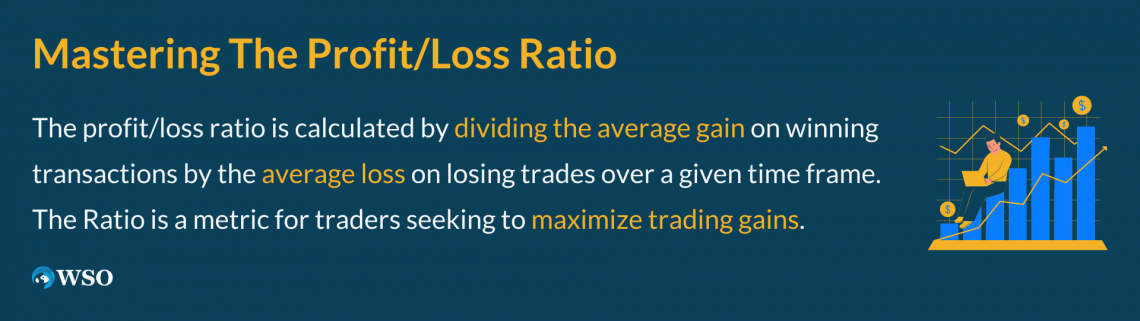
The formula for the Profit/Loss ratio is given by the average profit of winning trades divided by the average loss of losing trades, as illustrated below:
Profit/Loss = (Average Profit / Average Loss)
The common benchmark traders use for profit/loss is to have at least a 2:1 ratio, which indicates that the strategy or system is profitable two out of three times, suggesting to use the same strategy and/or system to create increased profits.
However, a low profit/loss ratio would indicate a poor strategy or system and will influence the trader to either abandon it or find ways to improve its’ performance to produce sufficient gains. The following video provides an explanation on what your profit/loss (or win/loss) ratio should generally look like.
Oftentimes, traders will receive a percentage of their Profit or Loss, as measured by their profit/loss ratio, as commission for making money for the firm. Conceptualizing this may be difficult, so here is an example to help consolidate all this information.
Example of the Profit/Loss Ratio
You start watching videos on stocks and investments and decide to get your life together and start investing in stocks. You scroll through a discussion on Wall Street Oasis and see a kid by the name of MonkeyManiac urging people to purchase shares of AAPL, MJD, HSJ, JBH, SBF and UGF, as they are all going to the moon!
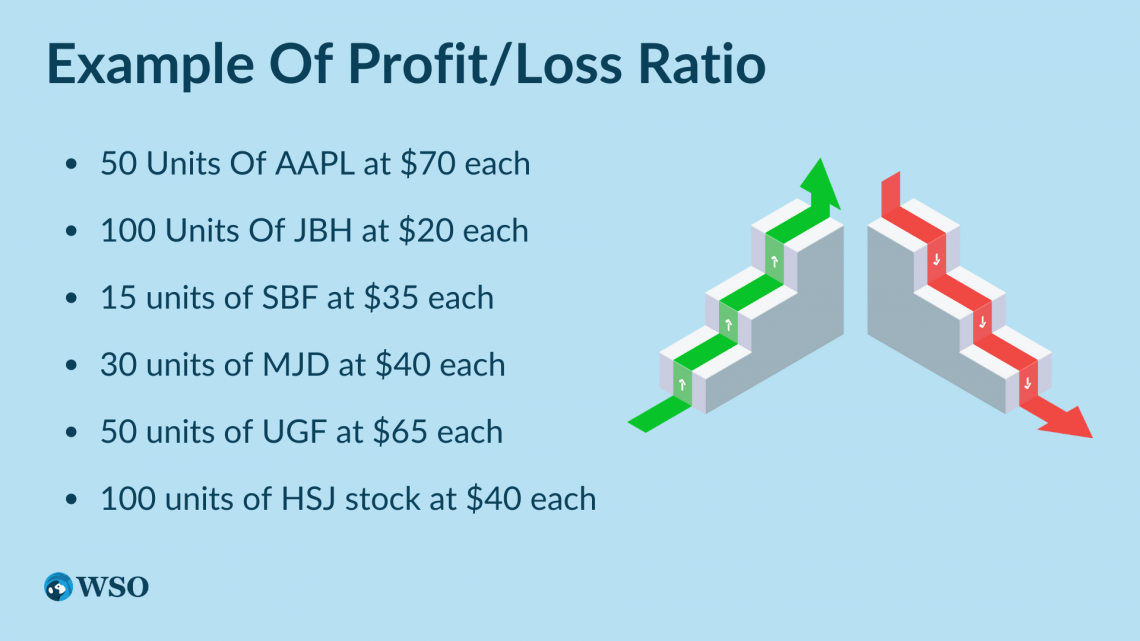
You decide to purchase 50 units of AAPL at $70 each, 100 units of JBH at $20 each, 15 units of SBF at $35 each, 30 units of MJD at $40 each, 50 units of UGF at $65 each, and 100 units of HSJ stock at $40 each.
2 years later, you decide to sell all your current holdings. You notice that AAPL stock rose to $120 per share, and JBH rose to $40 per share. However, SBF fell to $10 per share, MJD declined to $25 per share, UGF declined to $40 per share, and HSJ tanked to $15 per share. In summary, you
- Profited $2500 from AAPL
- Profited $1000 from JBH
- Made a $375 loss from SBF
- Lost $450 from MJD
- Realized a loss of $1250 from UGF
- Declared a $2500 loss from HSJ
Therefore, your average profit would be:
$3,500 / 2 = $1, 750
and your average loss would be:
$4,575 / 4 = $1,143.75
Calculating the profit/loss ratio using these figures would get us:
$1,750 / $1,143.75 = 1.53: 1
With the previous benchmark of 2:1, this ratio seems to show that we are underperforming but still not making us any losses, right?
Our trading strategy must be pretty good. However, there are limitations with this ratio as it does not account for the probability of wins or losses of trades but only the performance of those trades.
We are able to address this limitation through a concept called Average Profitability Per Trade (APPT).
What is Average Profitability Per Trade (APPT)
APPT is a concept used in trading that refers to the average amount that a trader can expect to win or lose per trade. Its use comes from the fact that it takes into account the probabilities of the wins and losses, showcasing a more accurate depiction of your trading performance.
The formula for APPT is given as:
APPT = (PP *AP) - (PL * AL)
where,
- PP = the profitability on a profitable trade
- AP = the average profit you make
- PL = the amount of loss on a losing trade
- AL = the average loss you make
Example of APPT
Using our last example, we made a total of 6 trades, of which 2 were profitable, and 4 were not. Therefore, PP = 33.3%, and PL = 66.6%
Our average profit (AP) = $1,750, and our average loss (AL) = $1,143.75.
Using the above formula, we get an average profitability per trade of:
(33.3% × $1,750) - (66.6% × $1,143.75) = - $178.99
Even though the profit/loss ratio was calculated to be 1.53:1, this trading approach only produces winning trades 33.3% of the time.
The APPT we determined tells us that it is likely for us to make a loss of $178.99 for every trade that we place, revealing the negative effects of losing more trades than winning.
As the profit/loss ratio has a huge limitation, it is important to assess trading strategies and systems using the concept of APPT, which takes into account the probability of making winning and losing trades.

Free Resources
To continue learning and advancing your career, check out these additional helpful WSO resources:


or Want to Sign up with your social account?