Earnings Before Tax (EBT)
It is a metric businesses use to measure their profitability before taking taxes into account


What Is Earnings Before Tax (EBT)?
Earnings before tax (EBT), also known as profit before tax, is a metric businesses use to measure their profitability before taking taxes into account. This figure is the pre-tax revenue of a business and is found towards the bottom of the income statement.
EBT is the last subtotal on the income statement, and to arrive at the business's net earnings, all you have to do is subtract taxes.
EBT accounts for all deductions besides taxes. Because EBT excludes taxes, it is often one of the main metrics that analysts use to compare different companies' performances against each other.
Profit before tax (PBT) is the figure which determines how much in taxes a company will have to pay. The more profit a company generates before tax, the more taxes that business will end up paying. PBT will always be greater than net income (excluding extreme cases where it will be equal to).
- Earnings Before Tax (EBT) measures a business's profitability before accounting for taxes, found on the income statement's last subtotal.
- EBT excludes all deductions except taxes, making it valuable for comparing different companies' financial performances across varied tax rates.
- EBT calculates the degree of financial leverage, gauging how changes in capital structure impact earnings sensitivity.
Understanding Earnings Before Tax
EBT measures earnings once all operating and non-operating business expenses, minus taxes, are considered.
Since profit before tax disregards taxes affecting a company's revenue, it is often seen as one of the best metrics when comparing companies' financial performances against each other.
All businesses are not subject to the same taxes, so comparing their net revenues may be misleading. Figures like profit before tax aim to give analysts and accountants a clearer picture of how companies compare to each other.
Using a figure like net earnings may be deceptive because different businesses in different states and countries suffer different tax rates, laws, and changing policies. EBT may also be used to compare a company’s performance across different periods, as tax rates may fluctuate over time.
PBT is a better metric to use than net income for companies with significant amounts of tax considerations because the net income would be skewed by the tax considerations.
It is also possible for a company to have other factors that affect its effective tax rates, such as tax credits and net operating losses (NOLs).
These factors would limit net income as an accurate metric of the company’s performance financially, for comparison and profit before tax would be a better indicator due to the exclusion of these tax considerations.
PBT is considered a “pure ratio,” which means that it uses numbers exclusively found in the income statement. So one can calculate the PBT of a company by only looking at that statement.
To calculate, we need to look at the formula:
Earnings before tax = Revenue - COGS- SG&A - Depreciation & Amortization
Or
NET Earnings + Taxes

The Income Statement and EBT
The income statement is one of the three financial statements used to report a company’s financial performance over a period (usually quarterly or annually).
As the name suggests, the income statement focuses on the expenses and revenue of a company and is used to calculate the profitability of the company.
On the last subtotal of the income statement, before net income, there is a line that represents profit before tax. It is categorized differently and sometimes goes by “income before tax,” but it means the same thing as earnings before tax or any other variation.
All of the information needed to calculate earnings before tax is already on the income statement, so it isn’t necessary to go searching for financial data.
One important use of EBT is: Pre-tax income can be used for various purposes, but one of the most significant uses of this figure is to calculate the degree of financial leverage a company might have.
The degree of financial leverage is a leverage ratio that measures how sensitive a company’s earnings per share is to fluctuations in the operating income of the business as a result of changes in its capital structure.
The formula for this is as follows:
EBIT/EBT = degree of financial leverage.
The higher the financial leverage, the more volatile the earnings will be.
EBT vs. EBIT vs. EBITDA
Analysts and accountants use many financial metrics to summarize a company's profitability, but EBT, EBIT, and EBITDA are among the most common.
1. Earnings before Tax (EBT)
As discussed above, EBT is the company's profitability with the exclusion of taxes. This makes it possible to compare different companies that face different tax rates due to being in different states.
2. Earnings before Interest and Taxes (EBIT)
EBIT means earnings before interest and taxes and is used once again as a way to compare different companies' profitability without the skew of interest expenses or taxes. EBT is the company's profitability before the deduction of taxes and includes both operating and non-operating items.
3. Earnings before interest, taxes, depreciation, and amortization (EBITDA)
EBITDA stands for earnings before interest, taxes, depreciation & amortization and is another metric used by analysts and accountants when calculating profitability.
EBITDA can be higher or lower than EBT, depending on the company's depreciation and amortization expenses. Depreciation and amortization are non-cash expenses, meaning they don't affect the company's cash flow.
But which of these metrics is the best to use? While they all account for standardizing a company's profitability across different governmental policies, EBITDA and EBIT go one step further than EBT.
EBIT and EBITDA exclude certain expenses but do not account for all tax implications or capital structure differences, which could be different from company to company depending on how much debt a company has or other interest expenses.
Interest can skew the profitability of a company just like taxes can, so EBITDA and EBIT are considered "better" metrics for comparing companies' financial performances.
EBIT and EBITDA are the most used valuation multiples (i.e., EV/EBITDA and EV/EBIT).
To understand the difference clearly, take a look at the table below:
| Metric | Definition | Purpose | Considerations |
|---|---|---|---|
| Earnings before Tax (EBT) | Company's profitability before accounting for income taxes | Allows comparison across companies with different tax rates. | Standardizes profitability, excludes tax influence. |
| Earnings before Interest and Taxes (EBIT) | Company's profitability before taking into account interest and tax expenses. | Focuses on operational performance without the influence of interest expenses and tax | Ignores interest costs, focuses on operational performance. |
| Earnings before interest, taxes, depreciation, and amortization (EBITDA) | Profitability excluding interest, taxes, depreciation, and amortization. | Useful for comparing profitability by eliminating non-cash expenses. | Excludes non-cash expenses, provides clearer cash flow view. |
Effective vs. Marginal Tax Rate
When building projection models, you'll need to know effective tax rate and marginal tax rate. The effective tax rate is the percentage of taxes paid divided by the profit before tax, or PBT.
For example, if a company earned $1 million before taxes and paid $300,000 in taxes, then the effective tax rate for the business would be 30% (300,000/1,000,000). This would mean that the business paid an overall rate of 30% in income taxes.
The marginal tax rate is the rate that applies to the last dollar of a company's taxable income.
In the United States, there is a system implemented that creates different tax brackets. Each bracket corresponds to a different range of income levels, and as the tax brackets get higher, an individual's income is taxed at a higher rate.
Income taxes are split up between the brackets, so different portions of the income are affected by different tax rates.
So if one person makes $50,000, not all of their income will be taxed at the same rate. A portion of their income will be taxed at 10%, some at 12%, and a small portion of the total will be taxed at 22%.
The marginal tax rate corresponds to the highest bracket one's income falls into. This is the type of tax rate the United States uses for its tax brackets - a progressive marginal tax bracket.
Effective tax rates use profit before tax, whereas marginal tax rate doesn't.
Due to there being differences in pre-tax income on the income statement and taxable income on the federal income tax filing form, the two tax rates are usually different.
Regardless, the tax rate is multiplied by the earnings before tax figure, and the result is the net income.
Earnings Before Tax (EBT) Examples
Let's say there is software as a service provider that is trying to calculate their earnings before tax.
This company doesn’t have any depreciation or amortization because it doesn’t have any infrastructure due to it being a software as a service company.
- Total Revenue = $30 million
- Cost of goods sold (COGS) = $10 million
- Operating Expenses = $5 million
- Interest Expenses = $2 million
The gross profit of the company would be $20 million.
When we subtract our cost of goods sold and operating expenses, we get our EBIT of $15 million.
To get to pre-tax earnings, we do the EBIT minus interest expenses.
That leaves us with: $15 million - $2 million, resulting in a PBT of $13 million.
From PBT, you can get the net income of the company.
If you wanted to calculate the pre-tax margin, you would do PBT divided by total revenue:
$13 million / $30 million = 43.33%
From PBT, you can calculate the net income of the company:
You multiply the PBT by the assumed tax rate (say 25% for this example), and the result of $3,250,000 would be your expected taxes.
Actual Income Statement of Apple (AAPL) — EBT Example
For this example, we’re going to be walking through an actual income statement of Apple (AAPL) to find out how we end up with earnings before taxes:
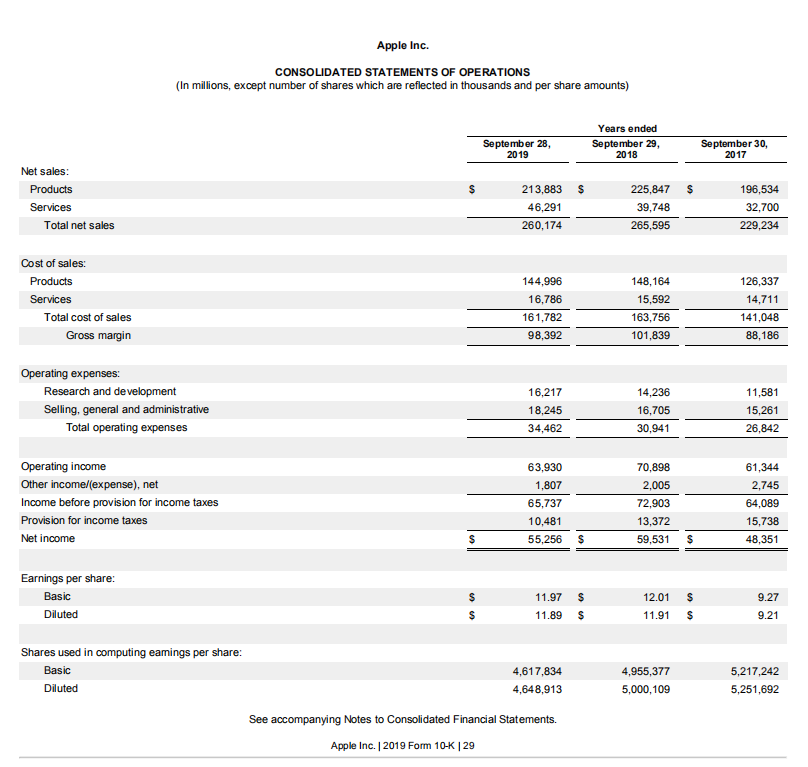
As we begin to look at the income statement, we see that Apple did $260 billion in sales.
But as listed above, to eventually get to earnings before tax, you have to subtract other deductions from this figure.
So we need to make sure to subtract the cost of sales in this statement (COGS), operating expenses (SG&A), and depreciation & amortization to get to income before provision for income taxes (EBT).
This would look like (in millions of dollars): A net revenue of $260,174 - $161,782 worth of cost of goods sold - $34,462 worth of operating expenses to get to our result of $65,737.*
*Depreciation & amortization are likely included in COGS or SG&A
The example above follows the first formula listed in the formula’s section of this article:
EBT = Revenue - COGS - SG&A - Depreciation & Amortization
Then we see that right after the income before provision for income taxes line, the tax is subtracted from the figure. The result of this is your net income!
As said before, we can use profit before tax to compare Apple’s financial performance from past years.
As we see, Apple had an $11,180 (in millions) increase from 2017 to 2018, which is a huge increase!
But we see from 2018 to 2019 that Apple was not able to increase its profits at the same rate.
Apple saw a $4,275,000,000 loss in net income. Regardless of if the tax rate changed from those three years, we can conclude that Apple’s best year was 2018, and its worst year was 2017.
Once again, we can also use income before tax to compare two different companies which suffer different tax rates than each other. Amazon is taxed at 21% of its income before tax, while Apple is taxed at 16%.
Below is the income statement for Amazon (AMZN):
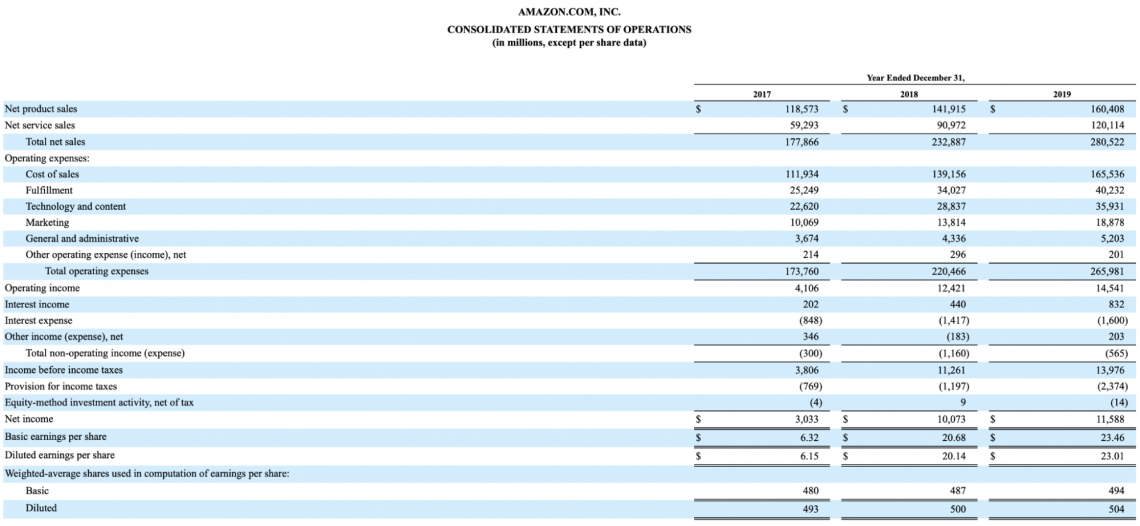
As we can see, the income before taxes for Amazon is $3,608,000,000 in 2019. Compared to Apple’s figure, Amazon is about $51 billion less for 2019. We can conclude that regardless of taxes affecting either company, Apple is more profitable than Amazon.
Earnings Before Tax (EBT) FAQs

There is actually no difference between earnings before taxes and pre-tax income! Pre-tax income is the earnings of a company before the earnings are taxed. This is found at the bottom of the income statement in the last subtotal before net income.
Earnings before tax are considered a “pure ratio” because all the information you need to calculate is exclusively on the income statement. You won’t have to switch between financial statements to calculate it.
Earnings before interest are used to calculate the profitability of a company and measure financial performance before the aspect of tax is involved.
It allows companies to get an “apples to apples” comparison between different companies that are subject to different tax rates because of factors like geological location.
EBT, EBIT, and EBITDA are all metrics to judge financial performance while eliminating some factors that skew net income.
Considering that profit before tax only accounts for removing taxes, while EBIT and EBITDA are independent of both taxes and capital structures, EBIT and EBITDA may provide a clearer picture when using these figures to compare different companies.


Edited by Colt DiGiovanni | LinkedIn
Free Resources
To continue learning and advancing your career, check out these additional helpful WSO resources:


or Want to Sign up with your social account?