Inverted Yield Curve
Represents the relations between interest rates and the time to maturity of debts


Why is the yield curve inverted?
An inverted yield curve is an inverted deviation from a standard yield curve, which is a graphic curve that represents the relations between interest rates and the time to maturity of debts.
In March 2022, the U.S. treasury yield was inverted. Traditionally, an inverted yield is a signal for a possible economic recession.
In this article, we will dive into the definition, the rationales behind the curve, why it can predict a recession, and evaluate the effectiveness of the inverted curve being the leading signal.
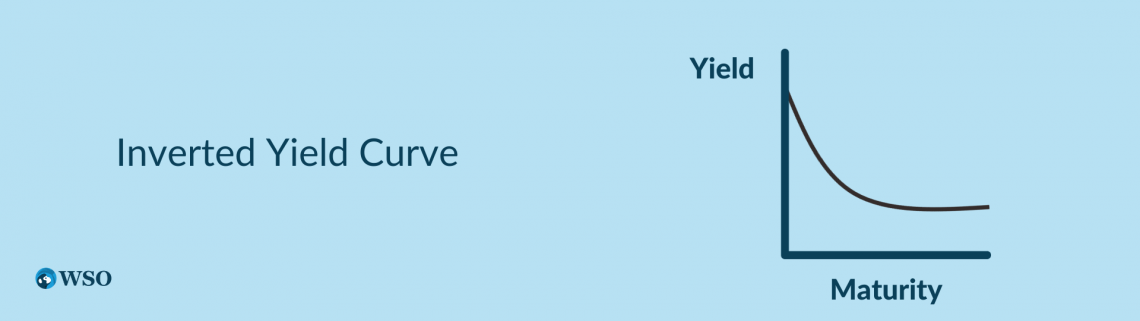
On the vertical y-axis, the graph shows the interest rate (yield), while on the horizontal x-axis, the chart shows the time to maturity of debts.
The yield curve usually refers to the U.S. treasury bonds yield curve. A normal yield curve is upward-sloping due to risk compensation.
An inverted yield curve is a rare shape of the yield curve. With the downward sloping shape, the bond market has a higher interest rate of short-term yield than the long-term yield.
- Inverted Yield Curve happens when short-term bond yields surpass long-term yields, signaling potential recession due to investor concerns about the economy's future.
- Factors like economic slowdown expectations and Federal Reserve rate adjustments lead to inverted yield curves.
- Historical data shows inverted yield curves often preceding recessions by 6-18 months, allowing time for portfolio adjustments.
- Economic theories - Expectation, Market Segmentation, Liquidity Preference - offer insights into yield curve shapes, though they might not capture all factors.
Understanding Inverted Yield Curve
The yield curve is inverted when long-term yields decline faster than short-term yields due to rising demand for long-term bonds. For instance, the 10-year U.S. Treasury bond instead of short-term bonds.
1. Investors' expectations
The yield curve shows the nominal interest rates and how inflation depreciates the value of future bonds and principal repayment. The formula for calculating the real interest rate is as follows:
Real interest rate = Interest returns - Inflation
So the curve represents the investor's expectation of the market's inflation.
Suppose investors predict that long-term interest rates will decline due to various perceptions. For example, an expectation of slower economic growth and a decline in inflation.
They will have a greater demand for higher-yielding short-term maturities over long-term maturities to hedge against risk.
2. A rapid increase in Federal interest rate
When the Fed raises the interest rate, it flattens the curve. Therefore, the yield may have been inverted because of this adjustment by the Federal Reserve.
Inverted Yield Curve and economic recession
Before the 1970s U.S. recession, economists rarely succeeded in forecasting the future of economic development, but the curve may be an exceptional indicator.
An inverted yield curve means that a recognized U.S. treasury pays a higher interest rate than long-term U.S. treasuries.
It was first recognized as an indicator of a recession by financial economist Campbell Harvey of Duke University in 1986.
What is the U.S. Treasury spread? The U.S. Treasury yield spread is the gap between long-term U.S. Treasury bonds and the Federal short-term borrowing interest rate. In general, the width of the spread is understood as the economic growth prediction in the coming years.
The most commonly used spread for the forecast is the 10-Year Treasury Constant Maturity Minus the 2-Year Treasury Constant Maturity of the U.S. Treasury bonds (T10Y2Y).
The yield curve is inverted when the 10-year yield rate minus the 2-year yield rate is below 0%.
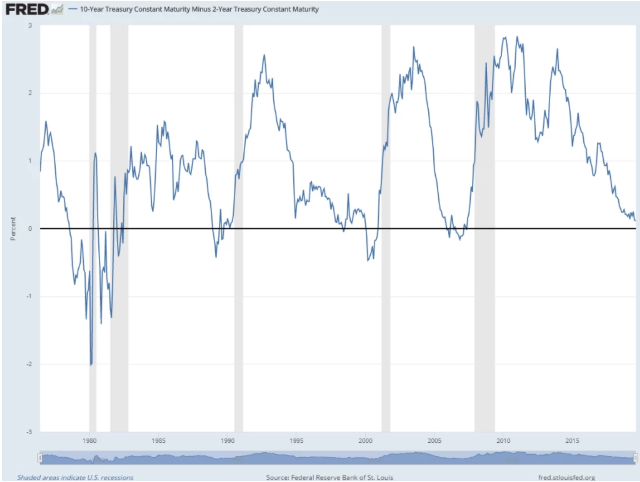
An economic recession (the gray area) follows when the curve emerges (the blue curve is below 0%).
| Yield Curve Inverted Time | Recession Begins | Lag Time |
|---|---|---|
| Aug 1978 | Jan1980 | 17 months |
| Sept 1980 | July 1981 | Ten months |
| Dec 1988 | July 1990 | 19 months |
| Feb 2000 | March 2001 | 13 months |
| Dec 2005 | Oct 2007 | 22 months |
| May 2019 | February 2020 | Seven months |
Since 1978, there have been six instances where the yield curve has inverted.
Generally, the time between the yield curve is inverted, and the recession is around 6 - 18 months, so investors have time to adjust their portfolio before the market retreat begins.
How do we use the curve as the forecast of recession?
The yield curve generally is used as a bond market indicator of confidence in forecasting economic activity.
A downward slope hints that the bond market expects the economy to have a recession.
With a negatively sloped curve, investors expect the interest rates to fall, which means that investment returns are also likely to fall.
Lower returns disincentivize investment, driving investment into long-term bonds and flattening the curve.
Central banks utilize monetary policy like raising the short-term Federal rate to counter inflationary pressure, which further flattens the curve by creating a lower expectation for inflation.
As a result, economic stagflation may emerge, a.k.a. Stagnation and inflation. Thus, an expectation of economic slowdown is consistent with a negatively sloped yield curve.
inverted yield curve shape Theories
Historically, famous economists like John Mathew Culbertson (invented market segmentation theory) and John Maynard Keynes (invented pure expectation theory and liquidity theory) have tried to explain the yield curve shape by writing various theories.
The most popular three theories, which have all been used to describe the previous yield curve shift, are:
-
The expectation theory
-
The liquidity preference theory
-
The preferred habitat theory
According to the expectation theory, the time frame of maturities is the same for investors since they expect long-term interest based on the short-term interest rate, assuming no other factors influence the yield.
This market segmentation hypothesis aims to explain the form of the yield curve by arguing that short-term and long-term securities have different demand and supply.
Because of their risk aversion, investors favor liquidity according to the liquidity preference theory. Consequently, borrowers must pay a premium for liquidity compensation under this premise.
Though the theories are sound in explaining the yield curve, they might not be able to fully explain the shift of the yield curve as it is affected by too many factors, and one might easily be neglected.
Pure Expectation Theory
Expectation theory suggests that the time frame of maturities is no different for investors due to investor expectation of long-term interest based on the short-term interest rate, given no other factors affecting the yield.
For example, the current yield for a 1-year bond is 1%, and Investors expect the yield for an identical 1-year bond one year from today to be 3%.
So the yield for a 2-year bond today is the average of these two years' yields:
(1%+3%) / 2 years = 2%
In other words, investing in various time frames only shows the compensations required for the expected average interest rate at a particular time in the future.
An inverted curve shows that investors expect that the short-term yield will fall.
However, this theory excludes the factors of interest rate risk and reinvestment risk, and it does not explain details regarding the changes in the slope of the curve.
Market Segmentation Theory
Market segmentation theory tries to explain the shape of the yield curve by assuming that demand and supply in short-term and long-term securities are separate.
Investors have different preferences for maturities, known as the short-term, medium-term, and long-term.
The bond market segmentation results from different usage by investors and borrowers to hedge their assets and liabilities with bonds under similar maturities.
1. Short-term bonds
The short-term bonds market depends on the short-term assets market, such as corporate's inventories and accounts receivable.
For example, companies have a better operating cash flow when short-term liquidity is high.
The demand for bonds will increase, and the supply will decrease as they have extra cash for investment and no need to sell bonds. As a result, the short-term yield rate will be lowered.
On the contrary, corporations must borrow money to avoid insolvency when they have liquidity issues.
Short-term bonds will increase because companies need to sell their bonds for cash. As a result, the yield rate will rise.
2. Medium and long-term maturity bonds
The demand and supply for medium and long-term maturity bonds depend on the corporation's incentives of gaining more capital.
When the economy is expected to expand, corporations are motivated to grow by purchasing more capital, requiring investment loans.
Thus, the supply for mid and long-term bonds increases as the bonds are sold for more cash to gain more capital, while the demand for bonds decreases as corporations look for other alternatives for investment, driving the yield rate higher.
Conversely, when an economic recession is expected, companies purchase more bonds to lower their risk and ensure a stable return.
So, the demand for mid-long-term bonds will increase, and the supply will decrease, ending in a lower yield rate.
Corporations act differently with different maturity lengths.
Market segmentation theory suggests that the bond market operates in various segments with different maturities and cannot be substituted for one another.
A flaw in this theory is that it cannot explain why the yields with different maturities move simultaneously.
Liquidity Preference Theory
The liquidity preference theory assumes that investors prefer liquidity due to their risk aversion nature. Under this assumption, borrowers must pay a premium for liquidity compensation.
Given that the demand for short-term securities is higher than the long-term securities, the price of short-term securities will be higher; correspondingly, the yield will be lower than the long-term securities, creating an upward-sloping curve.
Under a pessimistic expectation of economic growth, the risk of short-term loans gets higher, potentially resulting in the insolvency of the loans and lowering the general liquidity of short-term loans.
Thus, investors shift their capital to safer long-term loans and require a lower interest rate for compensation.
As a result, the yield curve is flattened under this situation.
Inverted Yield Curve – Measures of Inversion
It is understandable to become a little worried when the curve is inverted, but there are a few things you might want to check on to manage these emotions:
- Be cautious, but not panic
- Pay attention to the unemployment rate
- Consider the time lag between the inversion and recession
- Consider the possibility that it is an economic slowdown instead of a regression
1. Be cautious, do not panic
First, you should know that, like most technical indicators, the curve's inversion is imperfect. Therefore, the signal may be a false signal. So, it is an excellent time to be cautious instead of panicking.
2. Have an eye on the unemployment rate
The unemployment rate is a core indicator of measuring economic health. The recession is far from sight as long as unemployment rates stay low.
The U.S. Bureau of Labor Statistics can check the most recent U.S. unemployment rate.
3. The time lag between the inversion and recession
It is unsurprising that your first idea might be to sell your stock and buy bonds because of the coming economic downturn. The following may be the safest strategy to play for an economic downturn.
"Don't sell your stock and buy bonds immediately."
It is correct; the timing is everything. The time between the real recession and the inversion is around 6-18 months, so when you see the inverted curve, just be reminded not to rush to sell your stocks.
4. An economic slowdown instead of a regression
Things might turn out better than we thought. For example, the inverted yield curve might not always bring a recession behind it.
Instead, it might be an economic slowdown that has less impact on the performance of various assets.
Measures to Overcome Economic Recession
If the recession is coming, here are some ideas to consider:
1. Some defensive stocks that can survive
Even in a recession, some stocks have a greater chance of surviving the challenge. Therefore, it is suggested that investors might consider the sector less influenced by the economic cycle, like the consumer's staples.
2. Buying bonds
Buying bonds is another way to protect your wealth in a time of hardship despite their low-interest return.
3. Keep calm and keep investing
Remember that the economic slowdown does not last long. Therefore, you should review your asset allocation system according to your financial goals from time to time.
Follow your plan and avoid impulsive decisions, as it might lead to a compromise of long-term interests.
Inverted Yield Curve FAQs

The inverted yield curve usually refers to the U.S. Treasury bond yield curve. It is generally a leading indicator of an economic recession in the coming 6 - 18 months.
The yield curve has been inverted because the short-term bond rates are lower than the long-term bonds. It is generally affected by the expectations of economic regression, increase in the Federal interest rate and decrease in inflation.
On 31/03/2022, the 2-year and 10-year Treasury yields inverted since 2019. It means that the rate of the 2-year bond note is higher than the 10-year bond.
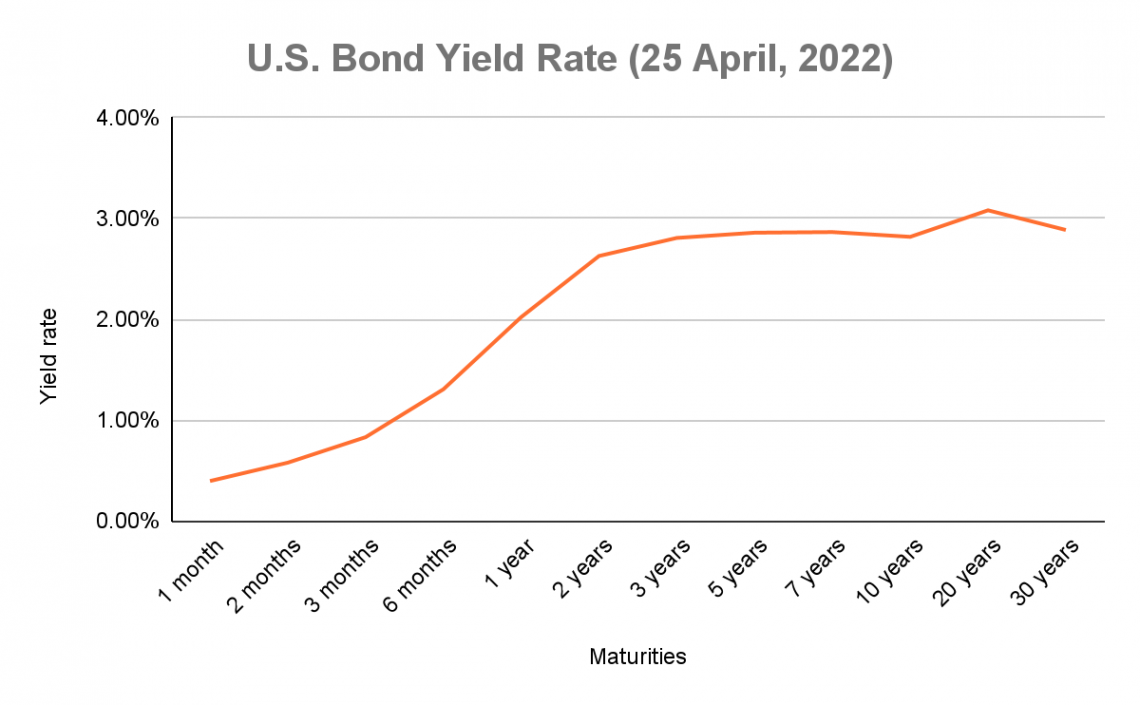
Up to 25/04/2022, the U.S. Treasury bonds yield curve is flattened yet inverted again since the last inverted on 31 March 2022.
When the yield curve is inverted, the investors tend to interpret this as a sign of possible economic recession. Then they will adjust their portfolio accordingly to more risk-hedging assets sector, i.e., the consumer stables, such as foods and beverages, household goods, and hygiene products.
The 10-year-2-year spread refers to the yield rate between the 10-year and the two-year U.S. bonds rate. In an inverted yield curve situation, the spread is below 0%.
Yes, since 1978, the inverted yield had predicted six economic recessions.
On average, 18 months. The shortest is seven months (before the 2020 recession), and the longest is 35 months (before the 2001 recession).
Historically, since 1987 the yield curve was inverted six times.
Almost every time the inverted yield curve emerges, an economic recession follows in 6 - 18 months.
Whenever the yield curve is inverted, it means capital flowing into the long-term capital rather than the short-term loans, which is seen as a hedging action. It shows investors are losing confidence in future economic growth.


or Want to Sign up with your social account?