Yield Curve
It is a chart plotting the yield of an asset against the maturity of the asset


What Is A Yield Curve?
A yield curve (also known as treasury yields) is a graphical line representing the interest rates on Treasurys on various maturities. Usually, the longer the maturities, the higher the interest rate they offer, which means an upward-sloping curve.
The most commonly used curve is generated from the U.S Treasury bond rates. (Most recent U.S.Treasury bonds rate update)
The curve is plotted on a graph where a bond’s yield is shown on the vertical axis while the time to maturity is shown on the horizontal axis. The curve is drawn by plotting the yields of the Treasurys according to various maturity dates.
Yield measures an investor's annual net profit on the security they invested. Yield (it excludes capital gains) is not the same as a total return because the latter is a more thorough measure of return on investment.
Yield shows the investor how much money they will get each year compared to the market value or the investment’s initial cost. It is calculated as below and is expressed as an annual percentage.
Yield formula:
Yield = Returns (dividends, coupons, or net income) / Price
Given that returns of the issued Treasurys are fixed:
- When the price increases, the yield goes down
- When the price decreases, the yield goes up
This means that the bond price and yield are negatively related. The price of bonds is determined by the demand and supply mechanics of the bond market.
- The yield curve represents the interest rates on Treasurys of various maturities, with longer maturities typically offering higher interest rates, resulting in an upward-sloping curve.
- There are five main types of yield curves: Normal (upward-sloping), Inverted (downward-sloping), Flat, Steep, and Humped. Each shape indicates different market conditions and economic outlooks.
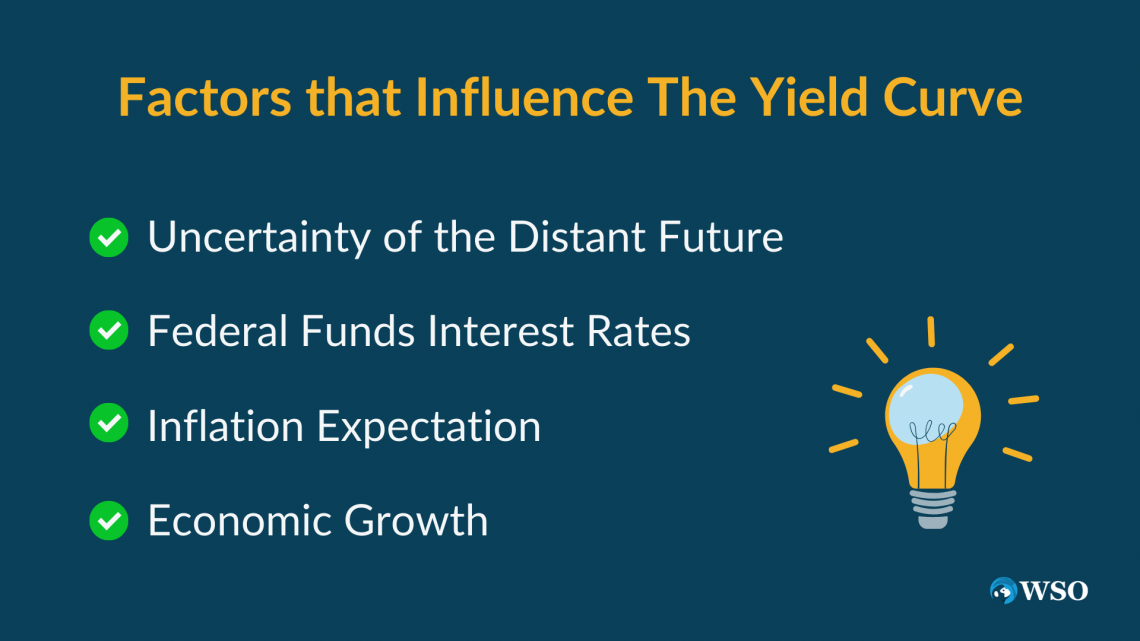
- Factors influencing the yield curve include uncertainty of the distant future, Federal funds interest rates, inflation expectations, and economic growth.
- The yield curve is used for interest rate forecasts, determining financial intermediary profits, understanding the relationship between yield and maturity, and gauging security prices.
- Theories explaining the shape of the yield curve include the Pure Expectation Theory, Market Segmentation Theory, Liquidity Preference Theory, and Preference Premium Theory. Each theory offers different perspectives on yield curve dynamics.
Yield Curve as a Risk Indicator
The bond yield curve is one of the indicators used to measure the overall risk perception of investors in the economy.
For example, if the yield on the 2-year Treasurys is getting higher while the yield on the 10-year Treasurys is getting lower, investors perceive the short-term risk to be higher than the long-term risk.
It is commonly used as a leading economic indicator, especially when it takes on an inverted shape which is regarded as a sign of an economic downturn.
This is because, unlike other economic metrics, the curve is not generated by a government or a single entity, making it a better gauge of market conditions.
What Are the Different Types of yield curves?
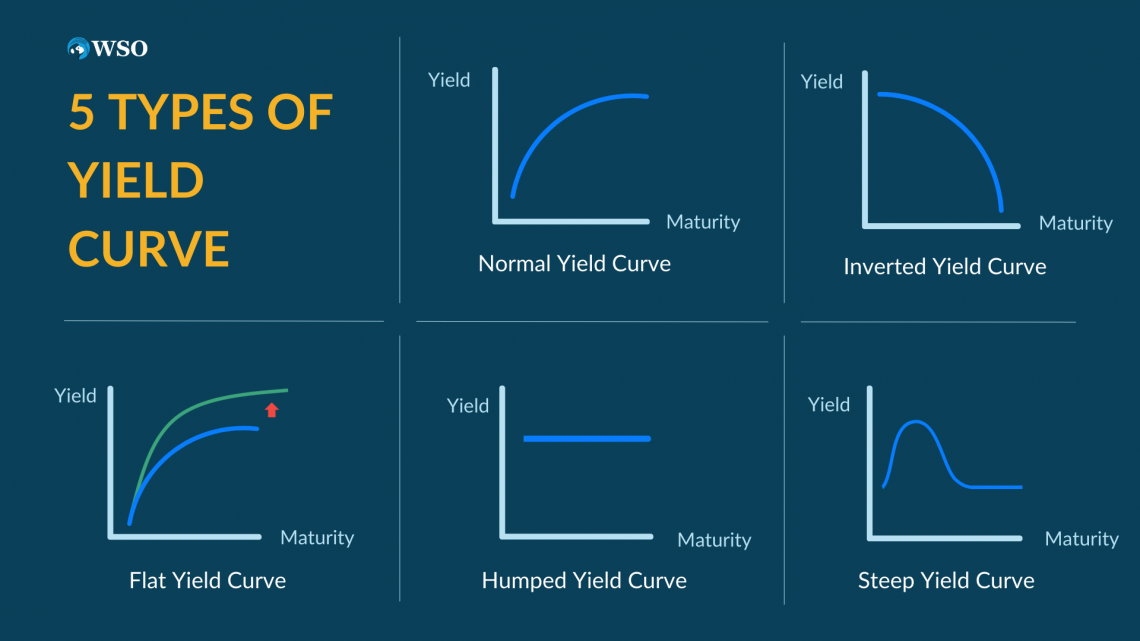
Due to different economic situations at various times, the curve can take various shapes. The five main types of the curve are:
- Normal Yield Curve (upward-sloping curve)
- Inverted Yield Curve (downward sloping curve)
- Flat Yield Curve
- Steep Yield Curve
- Humped Yield Curve
1. Normal Yield Curve
The normal upward-sloping curve is the most common type of curve. It represents a market situation where the interest rates for long-term bonds are higher than for short-term bonds.
This upward sloping curve is considered normal because, in a rational market, investors expecting economic growth will generally ask for a higher compensation (interest rate) for greater exposure to risk, as longer-term securities are exposed to more uncertainty.
This is usually associated with economic expansion.
2. Inverted Yield Curve
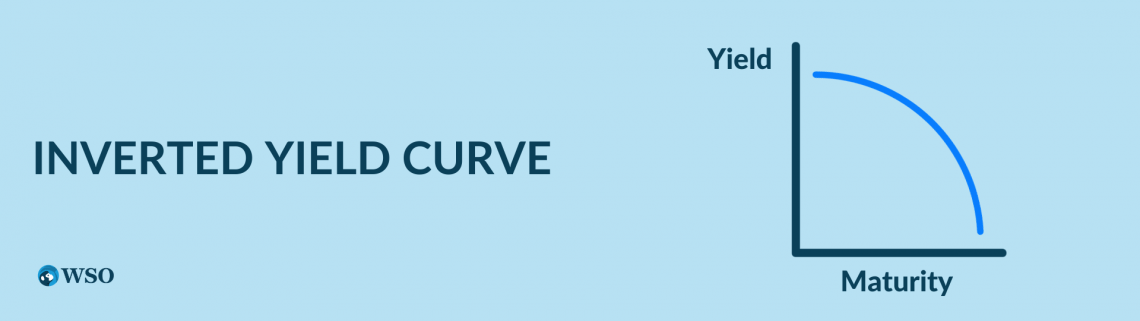
An inverted downward-sloping curve is an unusual type of curve. It represents a market situation where the interest rates for long-term bonds are lower than for short-term bonds.
This is because investors predict that long-term interest rates will decline due to various perceptions.
For example, an expected slower economy and a decline in inflation drive greater demand for higher-yielding short-term securities and lower demand for long-term securities.
The inverted curve is usually seen as a leading indicator of recession, suggesting the pessimistic market perception of the economy in estimated 6 - 18 months.
3. Steep Yield Curve
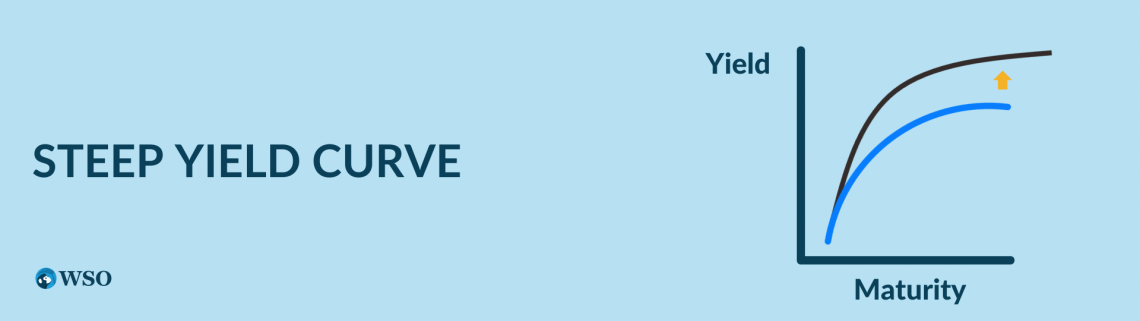
A steep curve represents a temporary scene in economic expansion, where the long-term yields increase quicker than the short-term yields.
A steep curve has a steeper slope than a normal curve. Therefore, compared to the normal curve, the difference between short-term and long-term yields is bigger in a steep curve.
This type of curve normally indicates the start of an economic expansion after a recession. As the curve steepens, banks can borrow money at lower rates and lend at higher rates.
4. Flat Yield Curve
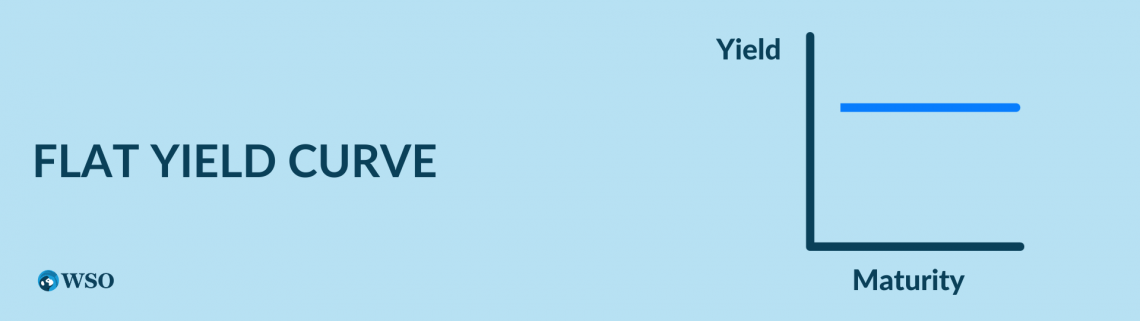
A flat curve is normally associated with a transitory change between the normal and inverted curves. It represents a market situation where the yields from all maturities become similar.
A flat curve can denote a change in the bonds market but is not necessarily seen as a solid indicator of a change in investors’ perspective on market expectations.
5. Humped Yield Curve
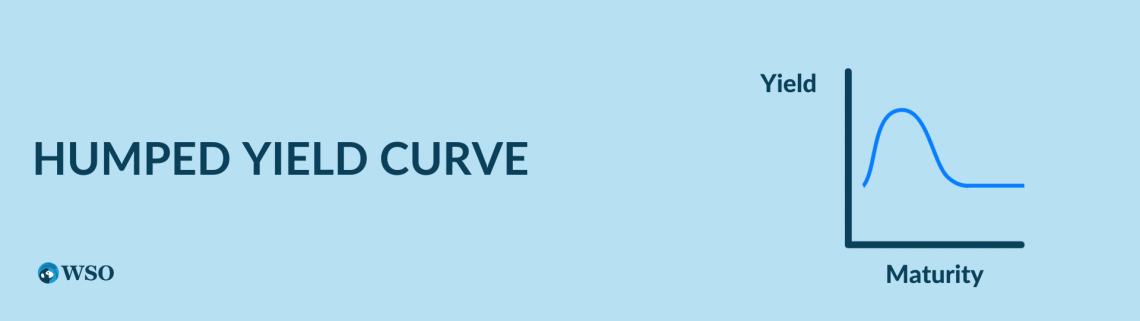
A humped curve, called a bell-shaped curve, is a rare situation where medium-term yields are higher than short-term and long-term yields.
It can result from a negative butterfly – a non-parallel shift in the yield curve where mid-term yields change by a greater magnitude than short-term and long-term yields.
Historically, returns following humped curves were either extremely good or tremendously poor. Similar to a flat curve, a humped curve represents a transitional state and isn’t normally used as an indicator for future expectations of the market condition.
What Are the Factors Influencing the Yield Curve?
As mentioned above, yield represents an investor's cash flow on the amount they invest in security. It is calculated as:
Yield formula:
Yield = Returns / Price
The factor affecting the returns of the securities is the rate set by the issuer. At the same time, demand and supply influence the price of the bonds in the bond market.
In general, four main factors affect the yield curve:
- Uncertainty risk with a longer time frame in the future
- Federal fund interest rate
- Inflation expectation
- Economic growth
1. Uncertainty of the Distant Future
Uncertain risk increases when the time frame of the security is further from now, as it’s more difficult for investors to make predictions about the distant future.
The “long end” of the curve is affected by the outlook of Federal Reserve policy to a certain extent. But it’s also affected by other factors, including expectations for inflation and economic growth.
The price performance of long-term debts is better when the growth is slower, inflation is lower, and risk appetites are depressed. On the contrary, when there is faster growth, higher inflation, and boosted risk appetites, the yield will rise, and the performance of long-term debts will dip.
2. Federal Funds Interest Rates
Central banks play an important role in influencing yields by changing the interest rates on Treasurys.
When a central bank decides to increase short-term interest rates to lower inflation, it reduces demand for the bonds issued before the rate hike, lowering bond prices and raising yield rates.
In short, the bond yield and the Federal interest are positively related. Therefore, increasing the Federal interest rate will increase bond yields.
3. Inflation Expectation
A steepening curve not only signals a strong economy but also can be a sign that higher inflation will occur. This is because stronger economic growth normally causes prices to rise.
In an economic expansion, investors who invested in longer-term debts would want higher yields to compensate for putting their money in the debt market for longer periods. When this happens, issuers would generally offer higher yields for longer-term securities.
4. Economic Growth
Economic growth is an important factor affecting the curve. Strong economic growth leads to an increase in aggregate demand, which contributes to inflation and a rise in the interest rate, pushing the yields.
As mentioned above, strong economic growth causes competition for capital between bonds and other emerging investing opportunities available in the market, driving up long-term bond yields. This results in a steeper yield curve.
What Is the Use of the Yield Curve?
The curve can be used for:
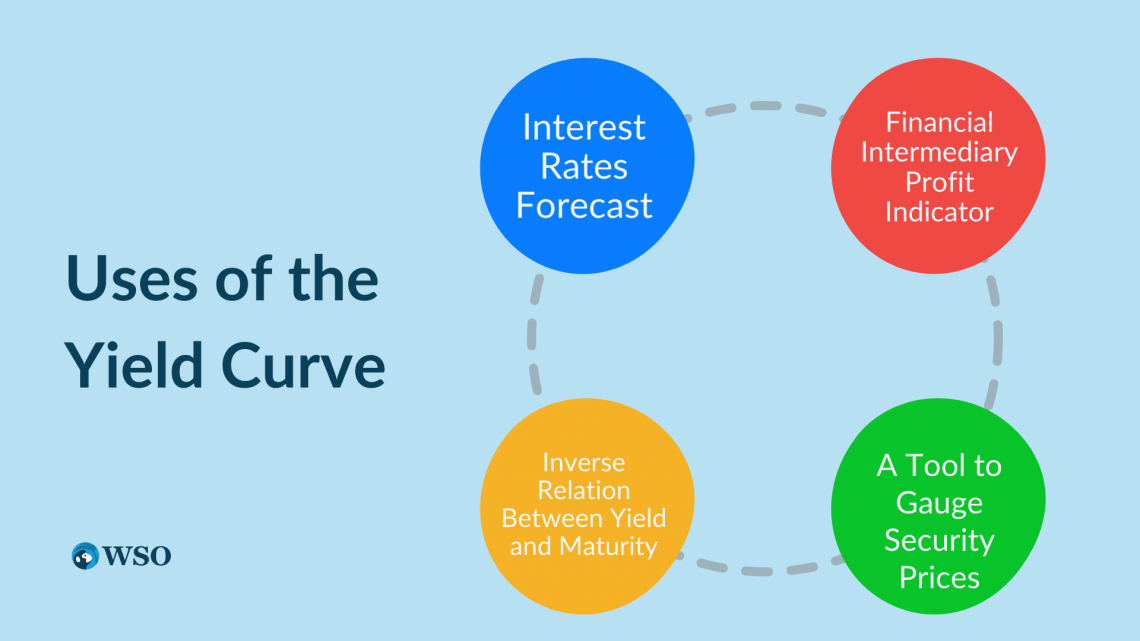
1. Interest Rates Forecast
The slope of the curve provides a hint of the future course of interest rates, helping investors make better investment decisions.
A normal curve means investing in long-term securities is more favorable as they provide a higher yield. In contrast, an inverted curve means short-term securities are more profitable as they have a higher yield.
2. Financial Intermediary Profit Indicator
Financial intermediaries profit from arbitrage – selling short-term deposits to borrow and issuing long-term loans to lend.
The difference in the interest rates between long-term loans and short-term deposits is the profit the banks and financial intermediaries make.
Arbitrage profits from selling short-term deposits and issuing long-term loans
= difference in interest rates
= long-term loan interest earned - short-term deposits interest paid
When the curve becomes steeper, the difference between the interest rates becomes wider, and the more profit the financial intermediaries make.
Contrarily, financial intermediaries would make less money when the curve becomes flatter.
3. Inverse Relation Between Yield and Maturity
The curve demonstrates the inverse relationship between yield and maturity. As a result, investors tend to invest in long-term securities to maximize their gains when the curve is upward-sloping.
4. A Tool to Gauge Security Prices
As Treasury bonds are considered a risk-free investment option, the U.S. Treasury yield curve represents the lowest return benchmark. By comparing the price of various securities to the curve, investors can determine whether a security is overpriced or underpriced.
Given a similar risk level, if a security's return on investment (ROI) is higher than the yield curve, the security is underpriced, and vice versa.
For example, corporate bonds are expected to have higher yields than Treasury yields due to the more risky nature of corporate default. Therefore, the yield spread between the two curves is considered the compensation for the additional risk.
yield curve Theories
There are four theories explaining the shape of the curve:
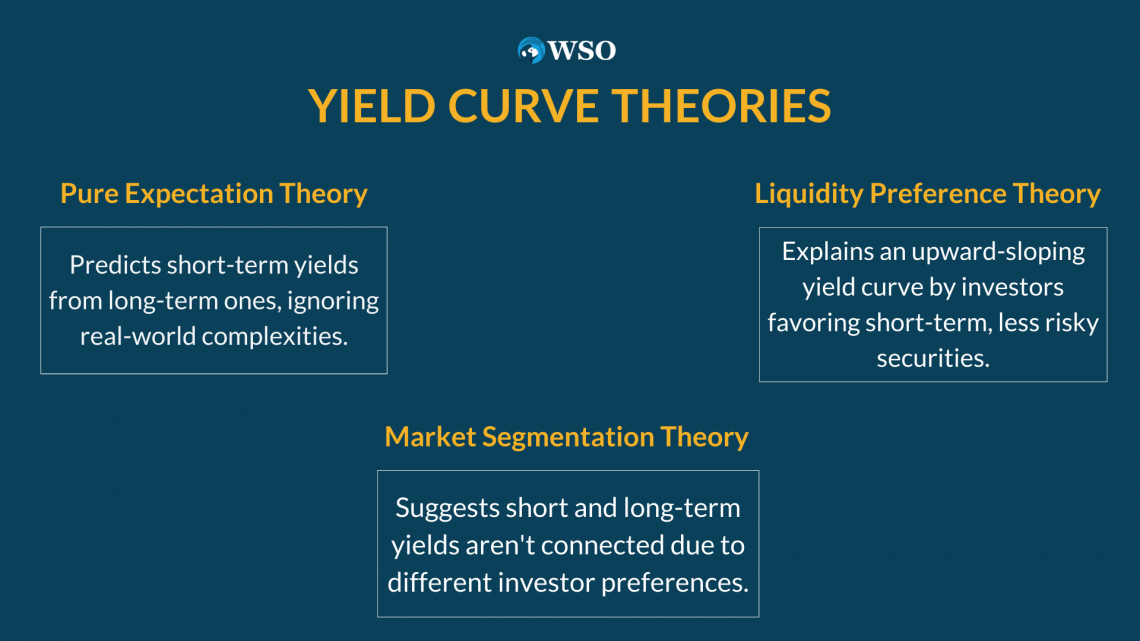
1. Pure Expectation Theory
The pure expectation theory states that long-term yields can be used to predict future short-term yields. According to the theory, long-term yields of a financial instrument are the average of the short-term yields expected to occur over the instrument's life.
More specifically, the theory claims an investor gets the same interest regardless of investing in a single two-year bond or two consecutive one-year bonds.
Even though compared to the two-year bond, the two one-year bonds would each have a lower yield individually, and the net outcome would be equal due to compounding interest.
However, this theory doesn’t work in the real world because it disregards interest rates and reinvestment risk. In addition, it fails to explain the details of the changes in the slope of the curve.
2. Market Segmentation Theory

The segmented market theory states that yields are based on a separate demand and supply relationship between short-term and long-term securities. Hence, it claims that long and short-term yields are not related to each other.
The theory is based on the assumption that different maturities of securities cannot be substituted for one another.
According to the theory, because short-term securities are less risky than long-term securities, investors would normally prefer buying the former over the latter. This causes short-term securities prices to increase, thereby lowering the yield.
The weakness of this theory is that it cannot explain why the yields with different maturities change together.
3. Liquidity Preference Theory
Liquidity preference theory states that investors prefer short-term maturity securities over long-term maturity securities due to investors’ risk aversion nature.
This is because longer-term securities are riskier than short-term securities, and investors naturally prefer highly liquid holdings.
Given the demand for short-term securities is higher than the long-term securities, the price of short-term securities will be higher. Correspondingly the yield will be lower than the long-term securities, creating the upward sloping curve.
Yield Curve FAQs

A plotted graph showing the yield distribution according to various maturities. It is usually used as a leading economic indicator.
In total, there are 4 types of the curve:
- Normal curve (upward sloping)
- Inverted curve (downward sloping)
- Flat curve
- Humped curve
The main factors affecting the curve are:
- Uncertainty of the distant future
- Federal funds rate
- Inflation
- Economic growth
The yield curve is usually seen as a leading indicator of economic growth trends.
When the curve appears to be inverted (when the 10-year yield minus the 2-year yield is smaller than 0%), it’s possible that there will be an economic recession in the coming 6 - 18 months.


Researched and authored by Ka Chun CHIU | LinkedIn
Free Resources
To continue learning and advancing your career, check out these additional helpful WSO resources:


or Want to Sign up with your social account?