Negative Correlation
A relationship between two variables in which one increases as the other decreases and vice versa.


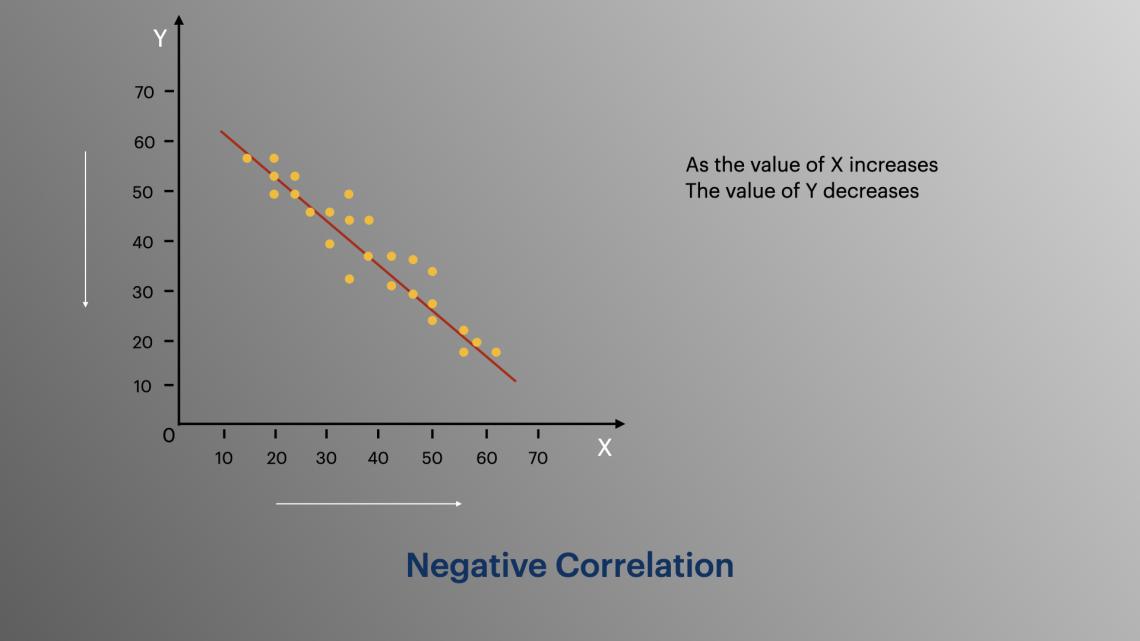
What is a Negative Correlation?
A negative correlation is a relationship between two variables in which one increases as the other decreases and vice versa. It means the relationship between both variables moves in the opposite direction with each other.
In statistics, a perfect negative is denoted as -1, whereas an ideal positive is represented as +1, and zero or no correlation is marked as 0. It is also known as inverse correlation.
Correlation is usually denoted as “r.”
Stocks and bonds are generally negatively correlated, but their measurement has changed in the last ten years from -0.8 to +0.2.
The degree to which one variable moves about another is measured by the correlation coefficient, which ranks the strength of the correlation between two variables.
For instance, the demand of variable A could be strongly negatively correlated with the price of variable B and may have a correlation coefficient. This means for every positive change in the price for variable B, the demand for variable A meets a decrease.
Another example would be when these variables could have a weak relationship. For example, a coefficient of -0.1 means for every unit of change in the price for variable B, the demand of variable A meets a slight decrease by 0.1.
The higher the negative correlation between two variables, the closer the correlation coefficient values to -1.
In the same way, two variables of positive correlation would have a correlation coefficient of +1. In contrast, zero or no correlation coefficient implies that the two variables are uncorrelated.
- A negative correlation occurs when two variables move in opposite directions, meaning that as one variable increases, the other decreases.
- This statistical relationship is measured by the correlation coefficient, which ranges from -1 to 1, with a value closer to -1 indicating a stronger negative correlation.
- Negative correlation is commonly observed in financial markets, such as the relationship between stock prices and bond prices.
- Recognizing and analyzing negative correlations can provide valuable insights for decision-making, risk management, and strategic planning across different disciplines.
Negative Correlation Examples
Here is a list of examples that indicate a negative correlation.
- The higher the number of absentees, the lower a student's grades will be.
- The more an individual works, the less free time they have.
- When a person's age increases, they often lose their agility.
- If a car's speed decreases travel time to a destination increases.
- The more time an individual prepares for a test, the fewer mistakes they'll make.
- When you spend more time brushing your teeth, your cavities will be fewer.
- The more air in a car tire, the less gas per mile the car can use.
- In areas with low amounts of rain, more wild animals will be able to migrate to other places.
- When lions spend a long time sleeping, they need less time to hunt during the day.
- The older an animal gets, the fewer offspring it can have.
- When an animal's hunger increases, its self-protection decreases.
- If it is darker outside, more light is required inside.
- As the weather gets colder, the use of air conditioning costs decreases.
- As snowfall totals increase, the number of people driving decreases.
- As the temperature decreases, people purchase more heaters.
- The warmer it is outside, the fewer layers of clothing one must wear to be generous.
- As one exercises more, their body weight decreases.
- When a biker’s speed increases, their time to get to the finish line decreases.
- The more an individual eats, the less hunger one will have.
Benefits of Negatively Correlated Assets in Portfolios
The value of an investor is on the concept of negative correlation, which enables them to identify two stocks that appear to be negatively correlated.
To understand it better, stock X tends to fall when stock Y rises; this means that an investor who owns both shares will find a counterbalance in the loss of one side by a gain on the other.
Both stocks are negatively correlated because they receive negative feedback directly from one another or because they respond differently.
In this article, we shall discuss two well-known cases.
In CASE 1, let's imagine two competitors, Sprite and 7UP.
In the beverages sector, the market share of these two firms is firmly locked on a battlefield; what seems good for Sprite will eventually be bad news for 7UP and vice versa.
A great new product introduced by 7UP will boost its market share price while Sprite falls. Therefore, close competitors will negatively correlate in a highly competitive market.
In CASE 2, two stocks will react oppositely to the exact external or indirect cause.
For example, financial stocks such as banks, insurance, asset management, credit cards, and brokerage companies tend to get a boost when interest rates rise.
Most investors study the correlation between stocks, industries, geographies, and the type of asset.
For instance, an investor in oil will safeguard a portfolio with stocks in airlines as these two industries are negatively correlated. When the price of oil drips, the stocks of airlines will rise and vice versa.
Negative Correlation Between Stocks and Bonds
One among the classifications of assets that are widely recognized is stocks and bonds.
Financial experts have advised that owning both stocks and bonds with weights that vary with investment goals, time horizon, and risk tolerance is that when stocks fall, bonds rise. Thus through diversification, it generates a risk reduction.
The negative correlation between stocks and bonds is in the theory of inflation, as the price rises, which benefits stock price because increased costs will be passed on to consumers translating into nominal profits.
On the other hand, often paying fixed interest rates, bonds will see the value of coupon payments that corrupt inflation, making them less valuable.
Another reason is relative riskiness. Bonds are often seen as less unstable and more conservative than stocks.
If an investor feels that stocks are overbought, the economy is shaky, and the selloff is likely, they may shift funds out of riskier assets like stocks and invest money in bonds.
Researchers dealing with the price relationship between stocks and bonds recommended that the assumed negative correlation is not straightforward and can be an illusion.
Looking back at 1926 showed that stocks and bonds had a positive correlation for an extended period of time with just three significant years of negative: 1929 - 1932, 1956 - 1965, and 1998 - 2003.
Example of a Negative Correlation
In this example, we will explain the Negative Correlation formula and the Positive and Zero Correlation formula will also be included to exemplify the differences between these three.
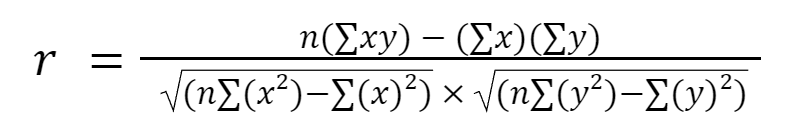
Where
- n = Number of observations
Let's find the negative correlation in this article from the above example of the number of absentees and students' grades.
| X | Y |
|---|---|
| 2 | 75 |
| 3 | 60 |
| 4 | 50 |
| 5 | 50 |
| 6 | 45 |
| 7 | 38 |
Let’s solve the following:
- x = number of absentees
- y = student's grades
| X | Y | X² | Y² | XY |
|---|---|---|---|---|
| 2 | 75 | 4 | 5625 | 150 |
| 3 | 60 | 9 | 3600 | 180 |
| 4 | 50 | 16 | 2500 | 200 |
| 5 | 50 | 25 | 2500 | 250 |
| 6 | 45 | 36 | 2025 | 270 |
| 7 | 38 | 49 | 1444 | 266 |
| 27 | 318 | 139 | 17694 | 1316 |
Here,
- n = 6; xy = 1316
- x = 27; x² = 139
- y = 318; y² = 17694
Let's apply the formula,
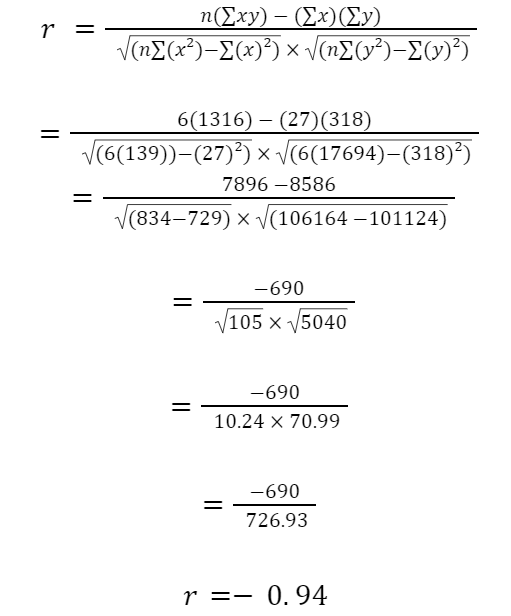
In this example, we examine the absentees and the student's grades. The number of absentees has been denoted as x (27) the grades of students as y (318), and the number of observations as (6).
We then multiplied the number of absentees and students' grades (1316) and took x² (139) and y² (17694).
Finally, we applied the formula, multiplied the number of observations by XY, subtracted x & y, then divided the whole, finding the square root and then dividing it, resulting in a negative relationship.
Thus, we can see the higher the number of absentees, the lower a student's grades will be.
Example of Positive Correlation
Let us take an example of a positive correlation to understand the correlation between customer demand and product price in a sales analysis of different team members.
| Price | Demand |
|---|---|
| 10 | 40 |
| 12 | 41 |
| 14 | 48 |
| 15 | 60 |
| 19 | 50 |
Let’s solve
- x = price
- y = demand
| Price | Demand | xy | x² | y² |
|---|---|---|---|---|
| 10 | 40 | 400 | 100 | 1,600 |
| 12 | 41 | 492 | 144 | 1,681 |
| 14 | 48 | 672 | 196 | 2,304 |
| 15 | 60 | 900 | 225 | 3,600 |
| 19 | 50 | 950 | 361 | 2,500 |
| 70 | 239 | 3,414 | 1,026 | 11,685 |
n = 5
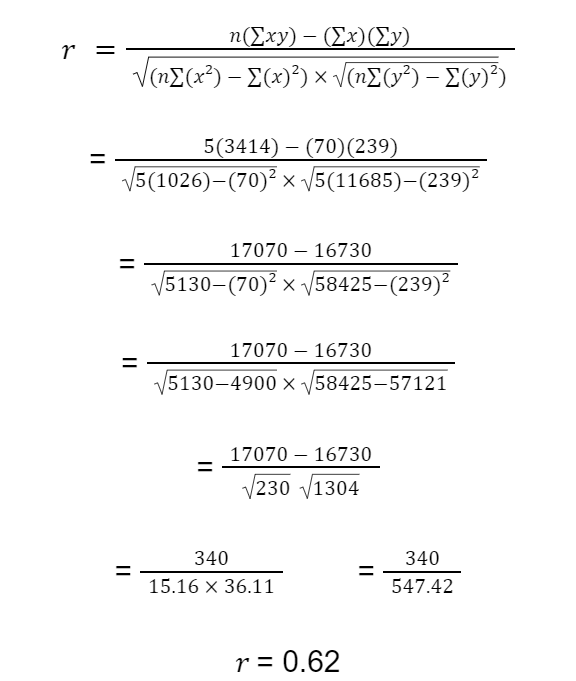
In this example, we examine the product's price and demand. Price has been denoted as x (70) and demand as y (239).
We then multiplied the price and demand (3414) and took x² (1026) and y² (11685).
Finally, we applied the formula and multiplied the number of observations by bearing price and demand, i.e., (XY) and subtracting x & y separately, then divided the whole, finding the square root and multiplying it, then separating, resulting in a positive relationship.
Thus, we can see that as the demand increases, the product price also increases.

Free Resources
To continue learning and advancing your career, check out these additional helpful WSO resources:


or Want to Sign up with your social account?