Quarterly Revenue Growth
The change in the sales or revenue every quarter that is when a company releases its quarterly filings 10Q.


What is Quarterly Revenue Growth?
Quarterly Revenue Growth of a company is the change in its sales or revenue every quarter, that is, in three months when a company releases its quarterly filings 10Q.
It is a measure of company expansion and growth in the market in terms of gross sales. Therefore, it described three months as a concise timeframe to judge a company's overall growth.
There are two ways people measure it,
- Cumulative: Direct difference of revenues in cumulative quarters.
- Seasonal: Measuring the difference of quarterly revenues by the same quarter from the previous year, for example, quarter 3 2022 and quarter 3 2021
This is especially useful in the case of companies whose sales are dependent on the time of the year (for example, raincoats in the rainy season)
Good quarterly revenue growth doesn't necessarily indicate a good investment in the company as the input timeframe is too small compared to the company's overall timeline; a good measure would be to track multiple quarterly revenue growths and see its general growth.
For the same reason, bad growth doesn't represent a bad investment either, as it could just be a small fluctuation in its overall growth.
- Quarterly revenue growth reflects the percentage change in a company's revenue from one quarter to the next, indicating how well the company is growing its sales over short periods.
- Investors and analysts use quarterly revenue growth to evaluate a company's recent performance and its ability to generate income in the near term.
- The formula involves comparing the current quarter's revenue to the previous quarter's revenue, then expressing the change as a percentage: ((Current Quarter Revenue - Previous Quarter Revenue) / Previous Quarter Revenue) * 100.
- Consistent quarterly revenue growth suggests strong business momentum, effective sales strategies, and market demand, which can attract investors and boost stock prices.
Uses of Quarterly Revenue Growth
Although it doesn't independently help analyze equity or stock returns, it's quite an indispensable tool for a company's forecasting.
Forecasting measures a company's intrinsic value by keeping the growth constant for several years until the company reaches maturity.
Tracked over a long period, this growth can give a general pattern of company growth and its future potential. And can be tracked into the future to guess future cash flows appropriately. This forecasting model is called the discounted cash flow (DCF) model.
Remember that having excellent quarterly revenue growth can still have bad implications if the customer acquisition cost is increasingly higher per quarter.
This makes the company reach a saturation point where customer acquisition cost is not feasible, and the growth might stunted, although this is a rare case.
Also, remember that the equity or the stock price could also be priced in, meaning that the stock's price already represents future growth and cash flows, indicating that the stock is correctly priced.
So, in summary, continuous quarterly revenue growth isn't necessarily an indication of undervalued stock, and negative continuous quarterly revenue growth doesn't mean a stock is overvalued.
How to Calculate Quarterly Revenue Growth
The percentage of quarterly revenue growth is described by
Quarterly Revenue Growth = [Quarter 2 revenue - Quarter 1 revenue] * 100 / Quarter 1 revenue
Let us look at an aerospace company named Boeing, ticker: BA,
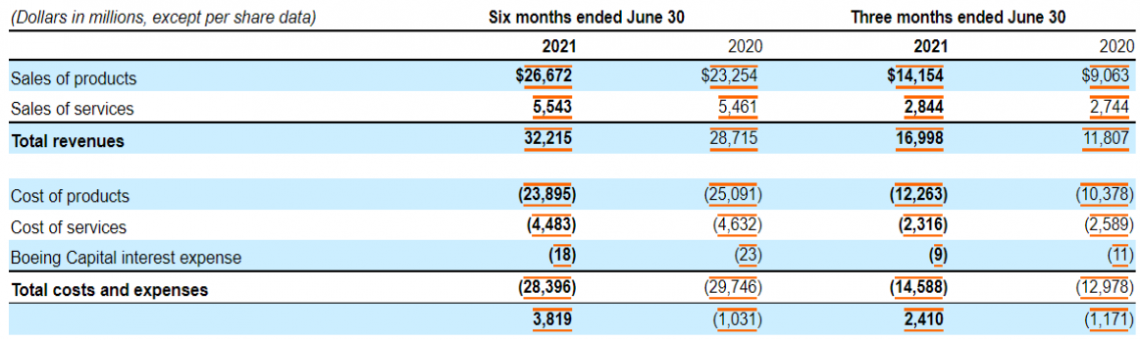
quarterly revenue growth = [16998 - 11807]*100 / 11807 = 43.96%
Remember, the growth here is calculated yearly; rather than using cumulative quarters, in the example, we've used quarter 2 from the years 2021 and 2020.
Conclusion
Though an inseparable tool, quarterly revenue growth doesn't correspond to any arbitrage in a stock value.
It's a tool to see a company's growth quarter over quarter and tracked over a long time to see how a company is growing and then can be further used to forecast its financials and net present value.
The outcome of this can sometimes be used to make an uncertain expectation model where if the realized Quarterly revenue growth is more than expected, Quarterly revenue growth could result in value fluctuation.
This could potentially change the company's whole past forecast and value. Therefore, analysts often revise their models each quarter as companies release their filings on SEC.gov.
It can also serve as a filtering system where an analyst could screen through stocks to filter out potential investments, for example, plotting ones that perform more or less than expected by a certain percentage.

Free Resources
To continue learning and advancing your career, check out these additional helpful WSO resources:


or Want to Sign up with your social account?