Variance Formula
Difference between actual and predicted results.


What is the Variance Formula?
The variance formula is employed to determine the discrepancy between a forecast and the final outcome. Both a percentage and an integer (the amount of money or the number of units) can be used to indicate the variance.
To evaluate outcomes and make wise decisions for a business's future, variance analysis and the variance formula are crucial components of corporate financial planning and analysis (FP&A).
Standard deviation is generated from variance and indicates how much each number deviates from the mean on average. It is the square root of the conflict of a dataset.
- Standard deviation: Expressed in the same units as the original values (e.g., meters).
- Variance: expressed in the unit squared (e.g., meters squared)
Since the units of variation are significantly larger than the units of an average value in a data collection, the variance number is more challenging to understand intuitively. Standard deviation is, therefore, usually employed as the leading indicator of variability.
The variance, as opposed to the standard deviation, offers additional details about variability and is used for statistical analysis.
Several formulas are used to determine variance, depending on whether you have data from the entire population or just a sample.
Population variance: you can acquire a precise figure for population variance once you've collected data from every member of the population you're interested in.
σ2 = [Σ(x - µ)2]/ N
Because the population variance measures dispersion, the conflict for a collection of identical points is zero.
The population standard deviation is the square root of the population variance, which reflects the average departure from the mean.
- Variance analysis and the associated formulas play a crucial role in corporate financial planning and analysis (FP&A), enabling businesses to evaluate performance and make informed decisions for the future.
- Variance analysis and the associated formulas play a crucial role in corporate financial planning and analysis (FP&A), enabling businesses to evaluate performance and make informed decisions for the future.
- Different formulas are used for population and sample variance calculations, each providing insights into the spread and variability of data, with standard deviation often used alongside variance for statistical analysis.
- Portfolio variance measures the dispersion of returns across assets in an investment portfolio, helping investors manage risk and optimize asset allocation to create minimum variance portfolios, thereby reducing overall price volatility.
What Is Variance?
The difference between actual and predicted results is measured by variance. It's used in personal budgeting and management accounting to assess if an individual or organization's income and spending have surpassed or fallen short of their planned amounts.
In other words, we can say that it represents the average squared deviation from the mean used to calculate the spread of a group of integers.
An individual or organization can compute the difference between actual and planned revenue and spending after the budgeting or accounting period to see if they went over or under budget.
By analyzing variation, an entity can take the necessary measures to align actual and planned amounts during the following accounting period, allowing them to deploy funds and negotiate better financial agreements more efficiently.
Your objective isn't to eliminate variance—that's nearly impossible, given that you'll almost certainly have fixed and variable expenditures. Instead, your goal should be to reduce variation.
The precise reason for the variance in your budget will determine how you go about lowering friction. Therefore, you'll need to examine that problem first.
We will now define what risk in an investment is, which is the primary definition of the variance.
Sample variance
To determine how diverse a sample is, one uses sample variance or s2. An example is a small subset of a population aiming to emulate the larger population.
For instance, it would not be possible (from a time or financial perspective) to measure the weight of every member of the population if you were measuring the consequences on Americans.
When you collect data from a sample, the sample variance is used to make estimates or inferences about the population variance.
The average squared deviations from the mean are how variance is technically defined. What does that signify in English, though? Let's divide the calculations into steps so that everyone can understand what one does to calculate variance:
- Determine the mean (the average weight).
- Square the outcome of each data point after subtracting the mean.
- Calculate the average of those differences.
S2 = [Σ(Xi - X̅)2]/ n - 1
Where
- Xi: The value of an observation
- X̅: The average of all observations
- N: The number of observations
Because using n would give us a biased estimate that regularly underestimates variability, we use n – 1 in the formula with samples. As a result, the sample variance is likely smaller than the population's genuine variance.
Now, we'll introduce portfolio variance...
Portfolio variance
Portfolio variance is a measure of a portfolio's return dispersion. It refers to the portfolio's overall returns over a specific period. In current portfolio theory, the portfolio variance formula is widely used.
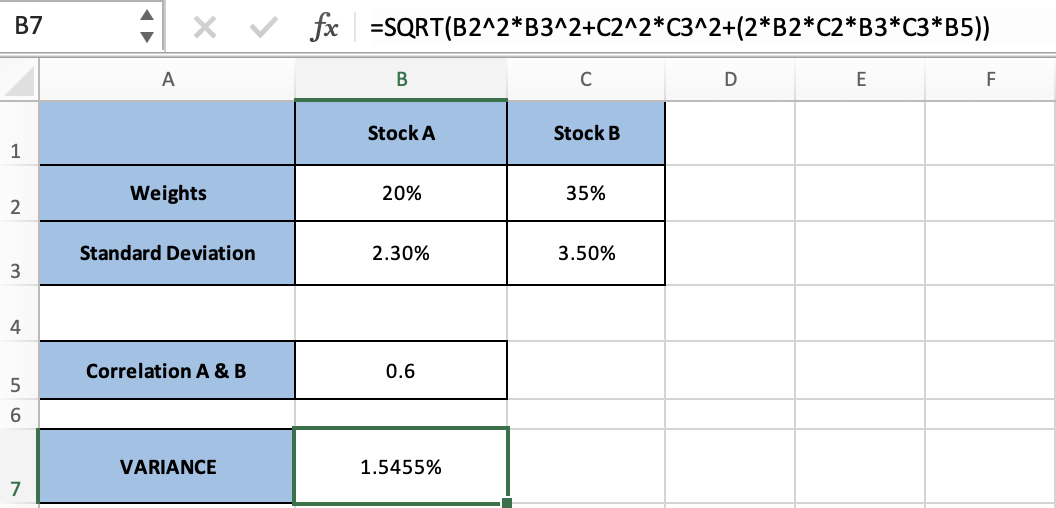
Portfolio variance is calculated by squaring the weights of the various stocks in the portfolio, multiplying it by the standard deviation of the portfolio's assets, and then squaring it again.
The numbers are then multiplied by the covariance of the individual assets multiplied by two, the weights of each stock multiplied by two, and the correlation between the different stores in the portfolio multiplied by two.
The formula may be summarized as follows:
W(1) * O(1) ^2 + W(2) * O(2) ^2 + 2 * P(1,2) * W(1) * W(2) * O(1) * O(2)
Where
- W (1): Weight of the first stock in the portfolio squared
- O (1): The standard deviation of the first asset in the portfolio squared.
- W (2): The squared weight of the second stock in the portfolio.
- O (2): The squared standard deviation of the portfolio's second asset
- P(1,2): The correlation between the two assets in the portfolio (between the first and second asset)
Example of 2- to 3-asset variance: We use this formula when we have more than one asset and a maximum of 3 purchases.
Example: We use this formula once we have a portfolio containing more than three assets to simplify the work.
This is known as the VAR-COVAR Matrix on Excel
=MMULT(TRANSPOSE(B2:E57-B76:E76),B2:E57-B76:E76)/(COUNT(A2:A57)-1)
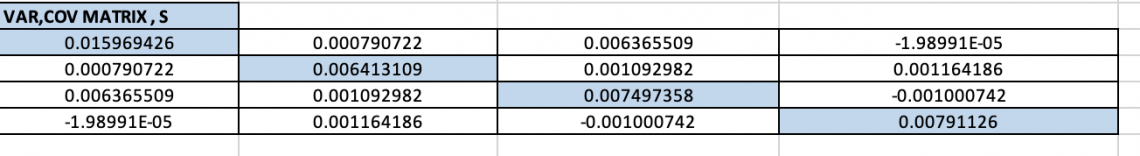
The variances of the variables are contained in the matrix's diagonal elements, while the covariances of every possible pair of variables are included in the off-diagonal members.
Minimum variance portfolio: A group of assets forming a minimum variance portfolio works together to reduce the entire portfolio's price volatility. Volatility is a gauge of how much a security's price fluctuates (ups and downs).
A minimal variance portfolio could have several high-risk equities, for example, but each from distinct sectors or various-sized firms, so they do not correlate with one another.
Applications of Variance Formula
Variance is widely used across various fields for analysis, decision-making, and modeling. Here are several key applications of variance:
Variance is used in finance to measure the volatility of asset prices. High variance indicates high risk, while low variance suggests stability.
In portfolio management, variance helps investors assess the risk associated with different investment options and optimize their portfolio allocations accordingly.
2. Quality Control:
Variance is employed to monitor and control the quality of manufacturing processes. It helps identify deviations from desired standards and allows for corrective actions to be taken.
In industries such as manufacturing and pharmaceuticals, variance analysis is crucial for ensuring product consistency and compliance with regulatory requirements.
Note
Variance plays a vital role in risk management across various domains, including insurance, healthcare, and project management.
3. Environmental Monitoring:
Variance analysis is employed in environmental science and monitoring programs to assess spatial and temporal variability in environmental parameters such as air quality, water quality, and biodiversity.
It helps identify trends, detect anomalies, and evaluate the effectiveness of environmental management initiatives.
4. Supply Chain Management:
Variance analysis is utilized in supply chain management to assess performance, track inventory levels, and optimize logistical processes.
By analyzing variations in demand, lead times, and production schedules, organizations can improve inventory management, minimize stockouts, and enhance customer satisfaction.
Advantages and Disadvantages of Variance Formula
Some of the advantages of the variance formula are as follows:
1. Measure of Dispersion: It helps in understanding how individual data points deviate from the average, offering insights into the variability of the data.
2. Useful in Decision Making: It allows decision-makers to assess the consistency and reliability of data, aiding in risk assessment and strategic planning.
3. Statistical Analysis: Variance helps in comparing different datasets, assessing the effectiveness of interventions or treatments, and identifying patterns or trends within the data.
Note
In manufacturing, variance serves as a critical tool for ensuring product quality and operational efficiency. By monitoring the consistency of production processes, businesses can identify and rectify deviations that may compromise quality standards.
Some of the disadvantages of variance formula are as follows:
1. Sensitivity to Outliers: Variance is highly sensitive to outliers or extreme values in the dataset. A single outlier can disproportionately influence the calculated variance, leading to potentially misleading results or conclusions.
2. Complexity: While variance is a valuable measure of dispersion, its calculation involves several mathematical steps, including squaring deviations, summing them, and dividing by the sample size or degrees of freedom.
3. Not Robust to Skewed Distributions: Variance may not accurately represent the spread of data in skewed distributions.
Conclusion
The variance formula serves as a fundamental tool in financial planning and analysis, enabling businesses to assess the difference between forecasted and actual outcomes.
This analysis is essential for evaluating performance, making informed decisions, and aligning future strategies. By understanding the variance between planned and actual results, organizations can identify areas of improvement, mitigate risks, and optimize resource allocation.
However, while variance analysis offers valuable insights, it also has limitations, such as its susceptibility to outliers and the need for interpretative judgment.
Despite these challenges, effective variance management can lead to better budgeting, improved decision-making, and enhanced organizational performance.
Everything You Need To Master LBO Modeling
To Help You Thrive in the Most Prestigious Jobs on Wall Street.
Free Resources
To continue learning and advancing your career, check out these additional helpful WSO resources:


or Want to Sign up with your social account?