YoY (Year over Year)
A year-over-year analysis (YOY) compares financial data from one period to the corresponding period in the previous year.


What Is Year-Over-Year (YOY)?
A Year-over-year (YoY) analysis compares financial data between a specific year and the previous year's corresponding period. It allows investors to assess the current financial situation of a company by computing specific ratios.
Similarly, when management needs to understand how their resources are used in financial performance growth for multiple periods, they need to compare the financial data from one period to another using a growth rate.
To achieve this, analysts and other financial users compare financial data for different periods using a metric that evaluates a company's performance and estimates its growth relative to the preceding periods.
A Year on Year analysis evaluates the growth or decline in the financial performance by comparing the preceding and the trailing year. The year indicated in this definition can either be a fiscal or a calendar year.
A fiscal year could also last for other periods, such as 1st April to 31st March. On the other hand, a calendar year measures the duration only from 1st January till 31st December.
- A year-over-year analysis (YOY) compares financial data from one period to the corresponding period in the previous year.
- It measures the rate of change for Key Performance Indicators (KPIs) like revenues, profits, or operating income.
- It helps estimate economic growth by comparing the GDP from two consecutive years.
- The YoY metric is straightforward to use. It facilitates easy comparison and decision-making while focusing on a long-term perspective.
- Alternatively, other analysis methods like Year To Date (YTD) or Quarter Over Quarter (QoQ) can be utilized depending on the specific needs and context.
Uses of Year-Over-Year Analysis
The following uses of the YOY analysis are as follows.
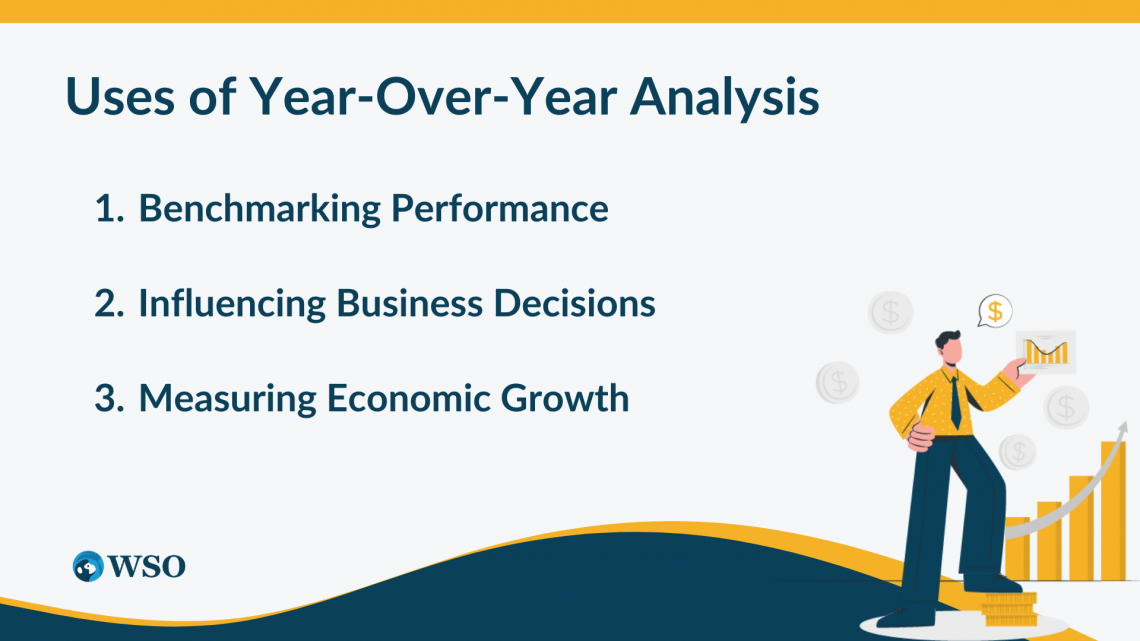
1. Benchmarking Performance
The YoY is used as a benchmark to compare the performance from a year before. It measures the rate of change for Key Performance Indicators (KPIs) like revenues, profits, or operating income.
2. Influencing Business Decisions
The YoY analysis for KPIs significantly impacts business decisions as it influences the progress at which the company's resources are actively used to create value.
Note
The management can identify business trends and forecast future performance using the YoY growth.
3. Measuring Economic Growth
The YoY analysis is used not only to measure a company's performance but also for economic growth. Both the government and the public need to measure economic growth.
Estimating the economic growth over the years can indicate how much money is being utilized and how much is being produced for the public.
Note
It is difficult to quantify economic growth accurately; however, the Gross Domestic Product (GDP) is the closest and most reliable indicator.
When the economy's growth is positive, it is in a boom. In contrast, when the economy grows negatively, it is in a recession. By using the YoY analysis of the GDP, the government can infer the state of the economy to formulate the Government Policy, i.e., monetary and fiscal policies.
Benefits of Year Over Year (YoY) Analysis
YOY analysis is a widely used metric to evaluate and compare performance over a year. It can be used to estimate the performance of companies and governments. The reasons behind its popularity are as follows:
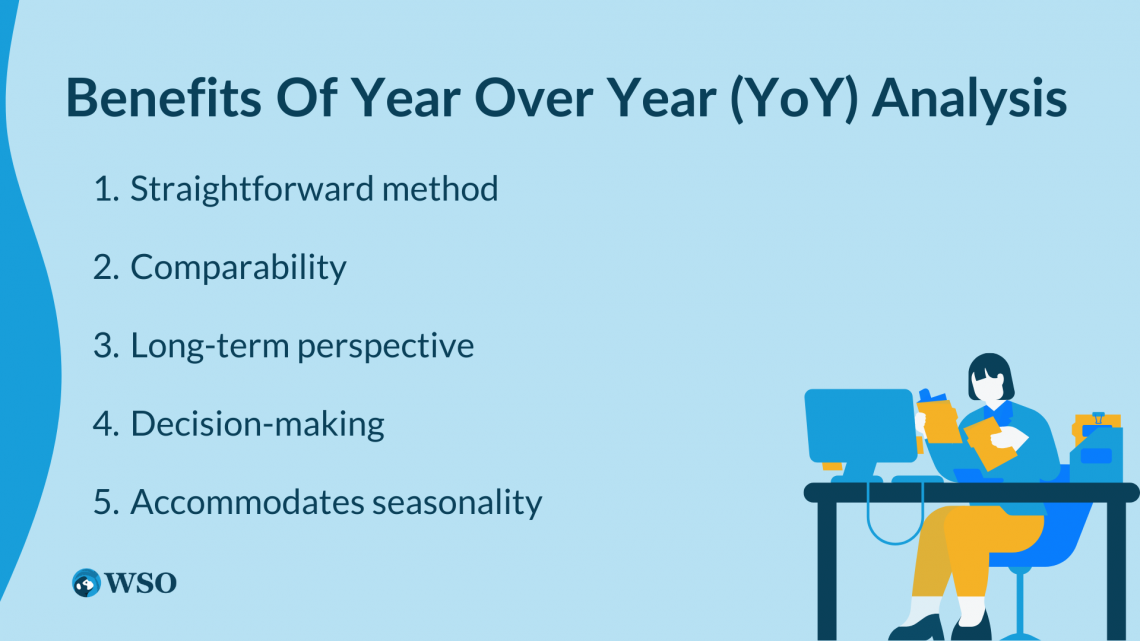
1. Straightforward method
The analysis provides a straightforward and easy-to-use method for estimating the growth or decline in financial performance. The formula is simple to calculate, making it accessible to investors, creditors, and other users.
2. Comparability
YOY analysis promotes comparison between financial data. Its comparability focuses more on the external users' perspective. Investors can construct portfolios by selecting the industry leader using various benchmarks.
This can be done because the metric facilitates competitor analysis whereby the investor evaluates different companies in the same industry.
Note
Comparing against the industry standards benchmark determines whether the company is over or underperforming.
Furthermore, investors and creditors are interested in analyzing this metric as it can help to understand the company's growth and expected growth rate. It can also filter out the dividend-paying companies from the non-dividend-paying ones.
3. Long-term perspective
Management can predict the future performance of revenue segments using historical data. This process is more commonly known as trend analysis. Managers can quickly gain insights into whether the resources a segment uses generate income for the organization as a whole long-term.
Note
A firm's liquidity and solvency are long-term indicators that a company will stay afloat. Using the YoY for trend analysis, an accountant can estimate the growth or redundancy in the liquidity and solvency ratios and identify areas that require attention.
4. Decision-making
YoY analysis indicates the increase or decrease in the revenue or profit for a segment from the previous year. This can help management form strategies and decisions regarding the upkeep or removal of a sales component.
Note
It can also be used for forecasting and allocating resources for the segments.
5. Accommodates seasonality
Every business undergoes predictable seasonality changes that occur regularly during a fiscal year. It can be reviewed as the periods when there is a high and low demand for the business.
For example, a supermarket during the holiday season from November to December faces an intense increase in demand and sales. They would encounter regular business sales after that, i.e., from January.
If management compares the sales data for two months in November and December to January and February, the result will show a decline in sales. However, this would be inaccurate as it does not include the seasonality factor.
On the other hand, if the management compares the sales data from November - December in FY1 to the same period in FY2, the data would be compatible as it relates to the same seasonal period.
Note
A YoY analysis also accounts for seasonality to facilitate the comparison of highly seasonal periods between the years.
How To Calculate the Year-Over-Year (YoY) Change?
The YOY analysis measures the annualized performance as a percentage.

The formula to calculate the YoY is below.
YoY = [Performancen+1 - Performancen] / Performancen
Where n is the base year.
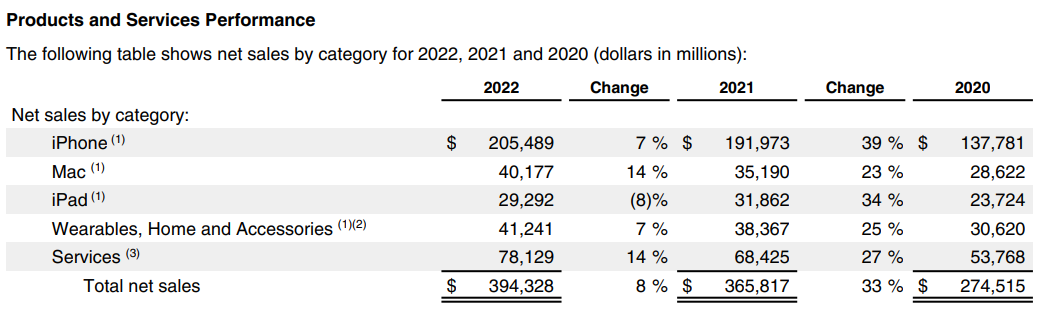
Some companies mention the percentage change in the revenue from the segments in their annual financial statements. It could be used to estimate the change in product segments.
For example, Apple mentions the YoY analysis as the percentage change in performance for their products and services, as seen in their 2022 Annual Financial Report (found on their investor relations page).
Let us calculate the YoY change for significant line items in the Income Statement of Apple’s 2022 Annual Report.
| Particulars | 2022 | 2021 | YoY Change (%) |
|---|---|---|---|
| Net Sales | 394,328.00 | 365,817.00 | 7.79% |
| Total Cost of Sales | 223,546.00 | 212,981.00 | 4.96% |
| Gross Margin | 170,782.00 | 152,836.00 | 11.74% |
| Operating Expenses | 51,345.00 | 43,887.00 | 16.99% |
| Net Operating Income | 119,103.00 | 109,207.00 | 9.06% |
| Net Income | 99,803.00 | 94,680.00 | 5.41% |
Alternatively, investors and managers can use Excel to compute the data.
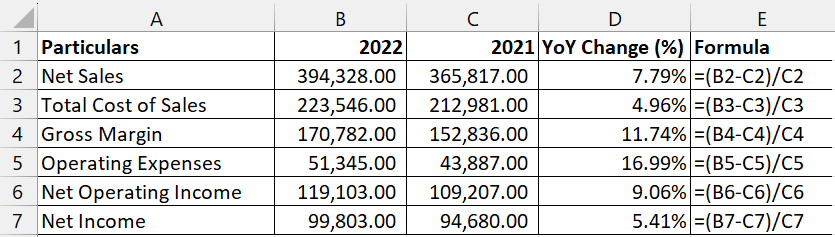
Now that we have calculated the YoY change, let us understand how it can be interpreted. When the resulting change is positive, it indicates positive growth. At the same time, a negative change indicates a decline.
Apple had positive growth from 2021 to 2022. Their sales, as well as operating income, have a considerable increase. The net income has a steady growth rate due to increased operating expenses.
Alternatives to YoY analysis
Managers use other tools to indicate the change in financial performance over time. They include the following.
1. Year to Date (YTD)
YTD is the financial metric that measures the financial performance from the beginning of the year to the current date. It is used by management, analysts, and investors alike to compare the performance during a particular year.
Usually, YTD comparison is used primarily for interim financial records and is calculated using the formula below.
YTD = (Performancecurrent date - Performancebeginning)/ Performancebeginning
Note
For most companies, the relevant period begins on January 1st if YTD starts at the beginning of the year. However, the fiscal year of the U.S. Government begins on October 1 and ends on September 30.
For example, an investor wants to know how much their portfolio has grown since January 1. They initially invested $10,000, and the portfolio is currently $12,000.
YTD (%) = ((12,000-10,000) / 10,000) * 100 = 20%
2. Quarter over Quarter (QoQ)
QoQ is the financial metric that measures the financial performance from different quarters. Usually, two consecutive quarters are considered. Like YoY, the QoQ analysis facilitates comparing government and business performance.
QoQ = [Performanceq+1 - Performanceq] / Performanceq
Where q is the base quarter.
QoQ analysis helps identify short-term trends and assess the pace of growth or decline within a business or economic environment.
Year Over Year (YoY) Analysis FAQs

The recommended growth rate differs per company and industry. Generally, a YoY growth between 10% to 40% is desirable. The growth rate for larger companies is usually lower compared to smaller companies.
The primary reason to estimate a growth rate and the YoY change is to understand how the inputs (company's resources) have generated sufficient outputs (revenue). It measures the company's net profit growth while also accommodating its seasonality.


or Want to Sign up with your social account?