Six Sigma
Provides the company with the tools to improve business health while delivering the highest possible product quality and profit at the lowest possible cost.


What is Six Sigma?
Six Sigma, the most expected quality and process improvement technique, provides the company with the tools to improve business health while delivering the highest possible product quality and profit at the lowest possible cost.
It aims to eliminate flaws in processes that can be linked to the inventive and ground-breaking work carried out at numerous organizations, including Ford, General Motors, Xerox, etc. As a result, many businesses today use this methodology.
As a result, it is mainly employed by development and manufacturing firms that wish to increase their efficiency. However, it can also be applied to project work using the rigorous DMAIC methodology.
Six Sigma applies to large and small enterprises and is not restricted to any particular industry.
The name has mathematical roots. The mathematical symbol for spread within the standard deviation is six sigma. Some numerous roles and components are utilized, which we shall examine in further detail.
Six Sigma Certification and Belt Rankings
You can employ a variety of roles inside Six Sigma to get the outcomes you want. It is crucial to understand these roles before implementing them.
If not, it will be virtually impossible to apply the strategy beneficially. So the first role we'll examine is the one that essentially makes all the decisions:
1. Executive Management
This person is the Six Sigma leader. The individual is accountable for outlining the overall objectives, ensuring sufficient resources for the projects, and offering a procedure or strategy for project management that can be analyzed and improved.
2. Black Belt
A skilled improvement leader holds this position with a solid understanding of the concept. As a Black Belt, you devote a significant portion of your time or job as a coach, method expert, and project manager.
Through extensive training and a greater focus on improvement work, a very seasoned Black belt can advance to the position of Master Black belt.
This project has numerous potential directions. For example, a more analytical or strategic approach, such as managing the company's Six Sigma efforts.
He is a highly skilled technique specialist who has a thorough understanding of complex problem solutions and analysis, which has a high impact on accomplishing the objectives in dynamic situations.
3. Green Belt
Many businesses value the flexibility that green belts offer by being able to use them as both project managers and employees. Black belts or Master black belts oversee projects that are vast and complex and work as employees.
They act as project supervisors in more modest neighborhood Green belt initiatives. Due to their simplicity and lack of complexity, these projects provide Green Belts with beneficial project management training.
4. Employees
Employees play a crucial part in a successful Six Sigma project. In certain businesses, they are given more responsibility by giving them more minor, more specific duties. Everyone is significant in this process improvement technique, including the employees.
Since the employees handle every aspect of the project, you must respect their views and pay attention to them. They will undoubtedly be the first to detect any issues. Therefore, you must urge them to speak with their superiors, such as Back or Green belts, if there are any.
How to implement Six Sigma
It is essentially a development over other techniques already in use. However, the emphasis on logistics and flows is lessened compared to some different methodologies, such as Lean six sigma.
The approach focuses on results that matter to users and converts these needs into quantifiable requirements; it’s called Critical To Quality (CTQs).
The fundamental tenet is that if we can quantify the number of defects present in a process, we can methodically determine how to eradicate them and approach zero defects.
One only needs to be capable of doing one thing to attain the alleged quality. The maximum number of errors that can be produced per million is 3.4.
If you make enough parts to generate up to one million possible error scenarios, you are only allowed to have 3.4 mistakes at most per million possible scenarios.
Sub-methods are employed to speed up the procedure to achieve this. The two have the names DMAIC and DMADV.
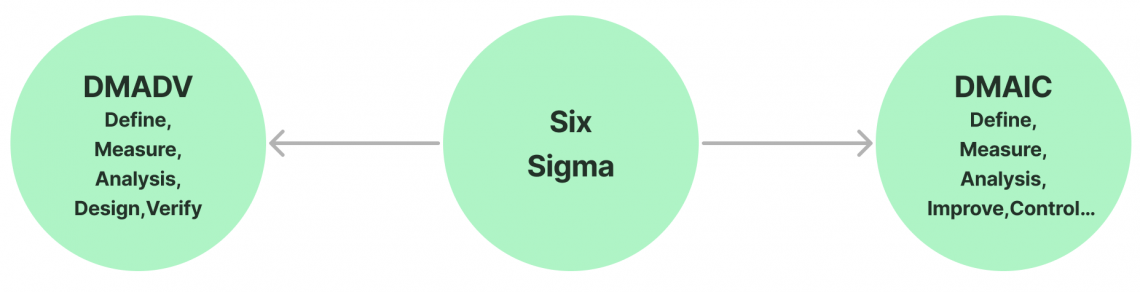
A. DMADV
DMADV means "define, measure, analyze, design, and verify." The DMADV approach is beneficial when implementing new tactics due to its early success detection, data-based foundation, and in-depth analysis.
Its framework aims to achieve the ideal balance between three views: the customer's demands, the process or procedure to meet those needs, and the company's goal or objective.
B. DMAIC
DMAIC is typically used to reduce variance in current processes. In contrast, DFSS, which stands for "Design for Six Sigma," is used to create new processes or products when heuristic data may not be accessible. Define, Measure, Analyze, Improve, and Control is the acronym for DMAIC:
1. Define
This phase's primary goal is to provide a project plan summary. The objectives of the process improvement project, the project's scope, and the identification of the clients (internal and external) and their needs are the main concerns of this phase.
This phase receives input from the voice of the consumer (VOC), the voice of the business (VOB), and the singer of the process (VOP). For example, we could use these tools in this phase:
Quality Function Deployment(QFD), Gantt Chart, Time Line Flow Chart, and Process Map.
2. Measure
The primary goal of this stage is to gather the information pertinent to the project's scope. This phase focuses on selecting the parameters. The measure phase can be divided into five major sections:
- Create process metrics.
- Assemble process data.
- Verify the data's quality.
- Recognize process behavior.
- Process capability and potential at the baseline.
In this phase, we could use these tools: IPO diagram of (input-process-output chain) or SIPOC (Suppliers, Inputs, Process, Outputs, and Customers).
3. Analyze
In this phase, the investigation of all potential root causes of the primary issue begins with this step. Then, these reasons are confirmed and validated using statistical and hypothesis testing procedures. Verified root causes are the phase's output and must be addressed to improve the process.
Care must be taken to locate and confirm the root causes throughout the analysis phase because accurate root cause identification is crucial to the success of process improvement through the sigma project.
We could use these tools in this phase: ANOVA, Scatter Diagram Regression, 5-Why, and Cause-and-Effect Diagram.
4. Improve
This phase enhances the process by identifying prospective answers, ways to put them into practice, testing them out, and putting them into use for improvement.
Process owners are consulted at this phase, and suggestions for changes are made. All necessary parties are informed of an improvement action plan.
The risk is reduced by the improvement plan, which also considers customer happiness and feedback. Therefore, the implementation phase begins concurrently with creating the improvement action plan.
Actions are carried out throughout implementation, evaluated for efficacy, and then officially implemented.
We could use these tools in this phase: Failure Mode Effect Analysis (FMEA), Hypothesis Testing, Affinity Diagram, and DEO.
5. Control
The primary goal of this phase is to create a thorough solution monitoring plan. This plan guarantees the maintenance of the needed performance.
It creates standards and procedures, evaluates benefits and profit growths, defines and validates the monitoring system, and connects with the business. Thus, the fundamental goal of the control phase is to guarantee that the gains are held.
We could use these tools in this phase: Presentation, Poka-Yokes, Standardization, Documentation, Control Charts, and Final Report.
Six Sigma Quality Management
DMAIC outlines the stages a practitioner should take, commencing with problem identification and concluding with the application of durable solutions. It is a method for enhancing currently used procedures.
Using this strategy, the company's existing processes can be improved without making significant changes that might face resistance from the workforce.
The expert drives process improvement using qualitative and quantitative approaches or tools. These processes include:
- Failure mode and effect analysis (FMEA)
- Statistical process control (SPC)
- Process mapping
These tools include:
Let's discuss each tool to decide which will work best for your plans.
1. Control charts
They determine whether process data is kept under Control for a shorter period. They include operating ranges or bands for process control limitations and, on occasion, customer specification limits.
To stay within the boundaries of process control, process data is evaluated. Every time data exceeds controllable levels; there are undoubtedly some unique factors that need to be looked at and removed right away.
These charts are used to ensure process data doesn't exceed control parameters. Various exception rules are also present to determine the condition of a process spiraling out of control while still being within control limits.
2. Flow Chart
A flowchart is a visual representation of a process with many steps organized in a particular order.
It is a standard tool for process analysis and can describe various processes, including project planning, administrative or service operations, industrial processes, and more.
A flowchart might comprise a series of steps, decisions that must be made, products or services entering or leaving the process, participants, the amount of time required at each stage, and process metrics to improve and communicate complex operations in detailed graphics.
When we examine all of the various flowchart forms, we can see that they are among the diagrams that are most commonly used worldwide, being utilized by both technical and non-technical persons in a variety of sectors. Some of the more technical names for flowcharts:
Process Flowchart, Process Map, Functional Flowchart, Business Process Mapping, Business Process Modeling and Notation (BPMN), or Process Flow Diagram (PFD).
They connect to well-known diagrams, including Data Flow Diagrams (DFDs) and Unified Modeling Language (UML) Activity Diagrams.
3. Pareto Chart
The Pareto principle is based on the Pareto chart. Engineer and economist Vilfredo Pareto created the Pareto code, also referred to as the 80/20 rule, which emphasizes unequal distribution. This is a result of its assertion that 80% of effects result from 20% of causes.
A Pareto chart is a graph with bars or one with both bars and lines. This graph shows a set of data as a bar graph. The line displays the total, while the lengths of the bars reflect the various numbers. A Pareto chart can be used to:
- Analyze broader causes by decomposing them into distinct elements.
- When too many issues are at play, focus a team on more serious problems.
- To help the team understand the significance of a cause, create a visual. Representation of it.
- Acquire knowledge to aid in prioritizing.
4. Histogram Chart
Histogram charts are available via Data distribution and can be produced with the help of the histogram tool. Both an input range and a bin range are accepted.
A bin range is a set of values that designates the upper and lower bounds for each histogram column. People frequently use a histogram chart to evaluate their performance.
5. Check Sheet
A form known as a check sheet is used to gather data in real-time at the source of the data. It may record both quantitative and qualitative data. The check sheet is occasionally referred to as a tally sheet when quantitative data is.
6. Ishikawa diagram
Kaoru Ishikawa, a pioneer of quality management systems in Japan, created the Ishikawa diagram in the 1960s,
The Ishikawa diagram, also known as the fishbone diagram, is a cause-and-effect diagram that aids in identifying the causes of issues, obstacles, flaws, variances, errors, or failures in the framework of your work. The problem is at the top of the figure, which resembles the skeleton of a fish, and its causes are listed and arranged to help adventure managers combat the problem.
7. Scatter Plot
A Scatter plot graph is utilized to examine the relationship between two variables. In essence, it demonstrates how one variable affects another.
Usually, a scatter plot contains a lot of data. The higher the correlation between the two variables, or the tighter the association, the more closely the data points resemble a straight line when plotted.
The variables are said to have a positive correlation if a straight line connecting the data points to high x- and y-values can be drawn from the origin. Conversely, the variables have a negative correlation if the line moves from a high value on the y-axis down to a high value on the x-axis.
Conclusion
For Six Sigma to reach its full potential, top management must be motivated and supportive. As a result, it is a top-down strategy. The success of projects depends on the support of top management.
Black belts should look for the best management assistance to implement improvements successfully. In addition to top management, dedication from all stakeholders and workers produces extraordinary results.
Excellence is sought in all work areas in firms where this process improvement technique is a component of the organizational culture.
The organization's culture and values heavily influence the methodology. Being excellent and seeking continuous improvement are obvious buy-ins to six sigma applications.
Companies attempting to create new products or manufacture existing ones must adopt them. Software businesses have employed various other techniques, but this one won't be effective in the future.
Although Scrum is quite common, Six Sigma is too rigid and cannot be developed in conjunction with the business. Therefore, in the future, we will require strategies that may be applied in conjunction with the company to hasten the development process.
Even if businesses must use it, investing is worthwhile if you believe it would benefit your company. However, using an Agile strategy like Kanban or a milestone plan might become more common.

Researched and authored by Ranad Rashwan | LinkedIn
Free Resources
To continue learning and advancing your career, check out these additional helpful WSO resources:


or Want to Sign up with your social account?