Annuity Table
It is a chart containing time-based factors and discount rates for a structured series of payments (or annuities).


What Is An Annuity Table?
An annuity table is a financial tool that contains time-based factors and discount rates used to calculate the present value of a series of structured payments, known as annuities. It simplifies the process of determining how much a future stream of payments is worth in today’s terms.
The table provides a factor that corresponds to the discount rate and the number of payment periods. By multiplying this factor by the value of the recurring payments, one can estimate the present value of the annuity.
Annuity tables are essential in various financial fields, including actuarial work, accounting, insurance, and tax planning, and are even utilized by the Internal Revenue Service (IRS). Professionals such as accountants, actuaries, and insurance analysts use annuity tables to record and evaluate the duration and amount of money invested in an annuity, which ultimately determines the payouts due to the annuitant.
- Annuity tables are a chart visualization that displays factors that are multiplied by the annuity of concern to reach a present value.
- Annuity tables are essentially present value calculations performed in each cell with the independent variables on both the X and Y axes. Therefore, they are easily derivable, and the table dimensions or independent variables can be customized when needed.
- Annuities X-axis are usually discount rates or interest rates, while the Y-axis is the periods of time
- The objective of annuity tables is to determine the highest present value extrapolated in multi-faceted and select the scenario that ensures time works in your favor.
Two Types of Annuities
The types of annuities are ordinary annuities and annuities due.
- Ordinary annuity: Payments are made at the end of the period. An example would be a music subscription since you use the service first for a month before making the payment.
- Annuity due: Payments made at the beginning of the period. An example would be apartment rent since you are paying before even utilizing their service for that month.
The annuity tables are also used to solve the common issue of whether it’s better to take a one-time lump sum now or receive periodic payments later.
Annuity tables might be useful in common scenarios pertaining to insurance, lottery, gaming wins, litigation, and other uncommon payouts.
Annuity Tables And The Time Value Of Money
The general premise of annuity tables follows the concept of the time value of money, where receiving a lump sum payment now is worth more than receiving the same amount of money in the future.
Opportunity loss, inflation, and other uncontrollable factors are the reasons why money decays, and having an interest, known as the discount rate, will allow a principal of money to be grown or at the very least, sustained over the long run.
Annuity tables perform the majority of the mathematical arithmetic for you. All you have to do is multiply the annuity payment’s value by the factor the table provides to get an idea of what the annuity is currently worth.
Let us say, for example, you have two options:
- Get paid a one-time lump sum of $5,000 now
- Get paid $5,000 at the end of the year
Assuming the same discount rate of 1%, option ‘a’ would be more advantageous, because option ‘b’ would mean missing out on earning 1% over the year. Option ‘a’ could grow the balance of $5,000 into $5,050 in the future.
If Option ‘a’ is considered the base scenario, Option ‘b’ would be worth $4,950. The future value of the $5,000 balance is $4,950 today because of the opportunity loss of 1% interest since you can only collect it at the end of the year.
This is a vastly simplified version when real-world scenarios have various factors that are highly situational.
Present Value of Annuity Calculations
This method is slightly more precise than an annuity table because the formulas don’t truncate digits when rounding.
Ordinary Annuity
The formula for calculating the present value of an ordinary annuity is as follows:
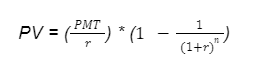
Where:
- ‘r’ is the interest rate (also referred to as the discount rate)
- ‘n’ is the number of periods in the annuity
- ‘PMT’ is the annuity payment
- ‘PV’ is the present value
Working Example
Let us assume someone wants to determine, in the ordinary annuity sense, whether it’s better to:
- receive a lump sum of $50,000
- receive an annuity that pays $10,000 for the next 5 years at a discount rate of 5%.
Plug the knowns into the Present Value formula.
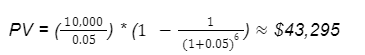
The present value of the annuity is around $43,265, lower than the lump sum.
Option ‘a’ with the lump sum would probably be more rational to choose because the lump sum is worth $6,735 over the present value of the annuity.
Annuity Due
As for calculating the present value of an annuity due, it can be found as follows:
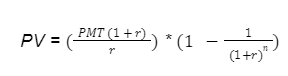
Where:
- ‘r’ is the interest rate (also referred to as the discount rate)
- ‘n’ is the number of periods in the annuity
- ‘PMT’ is the annuity payment
- ‘PV’ is the present value
Working Example
Let us assume someone wants to determine, in the annuity due sense, whether it’s better to:
- receive a lump sum of $50,000
- receive an annuity that pays $10,000 for the next 5 years at a discount rate of 5%.
Plug the knowns into the Present Value formula.
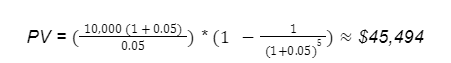
The present value of the annuity is around $44,494, lower than the lump sum.
Option ‘a’ with the lump sum would probably be more rational to choose because the lump sum is worth $4,506 over the present value of the annuity.
Note
- Annuity dues will generally outperform ordinary annuities given the same parameters over the long run, because the discount or interest rate can be applied immediately at the beginning of the period once the owner gets paid.
- In ordinary annuities where the annuity gets redeemed at the end of the first period, the present value would be lower, because of the missed opportunity cost of earning interest between the beginning of the period and the end of the first period.
Annuity Table And Its Present Value
Annuity tables are slightly less precise than the pure present value calculations themselves due to the fact that values past the ten thousandth digit get truncated. Nevertheless, the rounding is largely negligible, and the table is considered correct.
Ordinary Annuity
Encode the Ordinary Annuity formula into each cell with reference to years and discount rate. The annuity payment or PMT will equal 1, as the base value.
Here is an example of an ordinary annuity table per year for the next 10 years.
| Discount Rate | |||||||||
|---|---|---|---|---|---|---|---|---|---|
| Years | 1% | 2% | 3% | 4% | 5% | 6% | 7% | 8% | 9% |
| 1 | 0.9901 | 0.9804 | 0.9709 | 0.9615 | 0.9524 | 0.9434 | 0.9346 | 0.9259 | 0.9174 |
| 2 | 1.9704 | 1.9416 | 1.9135 | 1.8861 | 1.8594 | 1.8334 | 1.8080 | 1.7833 | 1.7591 |
| 3 | 2.9410 | 2.8839 | 2.8286 | 2.7751 | 2.7232 | 2.6730 | 2.6243 | 2.5771 | 2.5313 |
| 4 | 3.9020 | 3.8077 | 3.7171 | 3.6299 | 3.5460 | 3.4651 | 3.3872 | 3.3121 | 3.2397 |
| 5 | 4.8534 | 4.7135 | 4.5797 | 4.4518 | 4.3295 | 4.2124 | 4.1002 | 3.9927 | 3.8897 |
| 6 | 5.7955 | 5.6014 | 5.4172 | 5.2421 | 5.0757 | 4.9173 | 4.7665 | 4.6229 | 4.4859 |
| 7 | 6.7282 | 6.4720 | 6.2303 | 6.0021 | 5.7864 | 5.5824 | 5.3893 | 5.2064 | 5.0330 |
| 8 | 7.6517 | 7.3255 | 7.0197 | 6.7327 | 6.4632 | 6.2098 | 5.9713 | 5.7466 | 5.5348 |
| 9 | 8.5560 | 8.1622 | 7.7861 | 7.4353 | 7.1078 | 6.8017 | 6.5152 | 6.2469 | 5.9952 |
| 10 | 9.4713 | 8.9826 | 8.5302 | 8.1109 | 7.7217 | 7.3601 | 7.0236 | 6.7101 | 6.4177 |
The table metrics can be expanded or minimized on both Years of Discount Rates according to your preferences.
Working Example
Let us find the present values for:
- $2,000 per year for 7 years at an 8% discount rate
We will need to multiply the payment or annuity by the factor to find the present value.
Simply cross-reference year 7 on the Y-axis and 8% discount rate on the X-axis to reach the intersection point.
The number that is the subject getting intersected is the factor you multiply with the annuity.
$2,000 multiplied by 5.2064, arrives at approximately $10,413.
The present value of $2,000 per year for 7 years at an 8% discount rate is $10,413.
Annuity Due
Encode the Annuity Due formula into each cell with referencing to years and discount rate. The annuity payment will equal 1, as the base value just like Ordinary Annuities.
| Discount Rate | |||||||||
|---|---|---|---|---|---|---|---|---|---|
| Years | 1% | 2% | 3% | 4% | 5% | 6% | 7% | 8% | 9% |
| 1 | 1.0000 | 1.0000 | 1.0000 | 1.0000 | 1.0000 | 1.0000 | 1.0000 | 1.0000 | 1.0000 |
| 2 | 1.9901 | 1.9804 | 1.9709 | 1.9615 | 1.9524 | 1.9434 | 1.9346 | 1.9259 | 1.9174 |
| 3 | 2.9704 | 2.9416 | 2.9135 | 2.8861 | 2.8594 | 2.8334 | 2.8080 | 2.7833 | 2.7591 |
| 4 | 3.9410 | 3.8339 | 3.8286 | 3.7751 | 3.7232 | 3.6730 | 3.6243 | 3.5771 | 3.5313 |
| 5 | 4.920 | 4.8077 | 4.7171 | 4.6299 | 4.5460 | 4.4651 | 4.3872 | 4.3121 | 4.2397 |
| 6 | 5.8534 | 5.7135 | 5.5797 | 5.4518 | 5.3295 | 5.2124 | 5.1002 | 4.9927 | 4.8897 |
| 7 | 6.7955 | 6.6014 | 6.4172 | 6.2421 | 6.0757 | 5.9173 | 5.7665 | 5.6229 | 5.4859 |
| 8 | 7.7282 | 7.4720 | 7.2303 | 7.0021 | 6.7864 | 6.5824 | 6.3893 | 6.2064 | 6.0330 |
| 9 | 8.6517 | 8.3255 | 8.0197 | 7.7327 | 7.4632 | 7.2098 | 6.9713 | 6.7466 | 6.5348 |
| 10 | 9.5660 | 9.1622 | 8.7861 | 8.4353 | 8.1078 | 7.8017 | 7.5152 | 7.2469 | 6.9952 |
Working Example
Let us find the present values for:
- $2,500 per year for 9 years at a 4% discount rate
We will need to multiply the payment or annuity by the factor to find the present value.
Simply cross-reference year 9 on the Y-axis and 4% discount rate on the X-axis to reach the intersection point.
The number that is the subject getting intersected is the factor you multiply with the annuity.
$2,500 multiplied by 7.7327, arrives at approximately $19,332.
The present value of $2,500 per year for 9 years at a 4% discount rate is $19,332.

Free Resources
To continue learning and advancing your career, check out these additional helpful WSO resources:


or Want to Sign up with your social account?