Downtrend
A financial market condition represented by lower highs and lower lows in the price chart pattern.


What Is a Downtrend?
A downtrend is a financial market condition represented by lower highs and lower lows in the price chart pattern. It describes that the stock price will move to a lower price point than its previous position.
When a specific stock/security price moves in a particular direction, it represents a price trend. Price trends are further classified into two types a) Uptrend and b) Downtrend. In this article, we will be focussing more on a downtrend.
Trends are generally formed by peaks and troughs, also known as swing highs and swing lows. In a downtrend, peaks and troughs move in descending directions. Peaks are called higher points, and troughs are called lower ones.
It can vary from a gradual continuation to a sharp decline. This trend is also known as a bearish trend. Short selling is a widely used strategy to make profits while trading in bearish markets.
Technical analysts use a combination of trendlines and indicators like moving averages and RSI for taking trade calls.
This trend is usually observed when the sellers are more than buyers in a market or the price of a security is influenced by macroeconomic factors, news, and changes in a company's fundamentals.
-
A downtrend is a financial market condition characterized by a series of lower highs and lower lows in the price of a security. It signifies a consistent decline in the market value of an asset over time.
-
Downtrends can be caused by various factors, including negative economic data, poor company performance, unfavorable industry trends, market sentiment, and broader macroeconomic conditions.
-
To identify a downtrend, traders and analysts look for descending peaks and troughs on price charts, indicating persistent selling pressure.
-
During a downtrend, investors may experience a decline in the value of their holdings. It can lead to negative sentiment and increased selling activity as investors seek to minimize losses.
Downtrend vs. Uptrend
When peaks and troughs move in an ascending direction, it is known as an uptrend.
It is represented by higher highs and higher lows in the stock pricing chart.
It is usually seen when there is positive news about the company or industry that directly or indirectly affects the price of a stock. Investors generally take a long position during uptrends.
When peaks and troughs move in a descending direction, it is known as a downtrend. It is represented by lower highs and lower lows in the asset price chart.
Any bad news in the market, like a decrease in quarterly profits of a company or a change in interest rate, can result in a downtrend. As a result, traders either sell off their positions (as it reduces their profit margin) or go for short selling.
Example
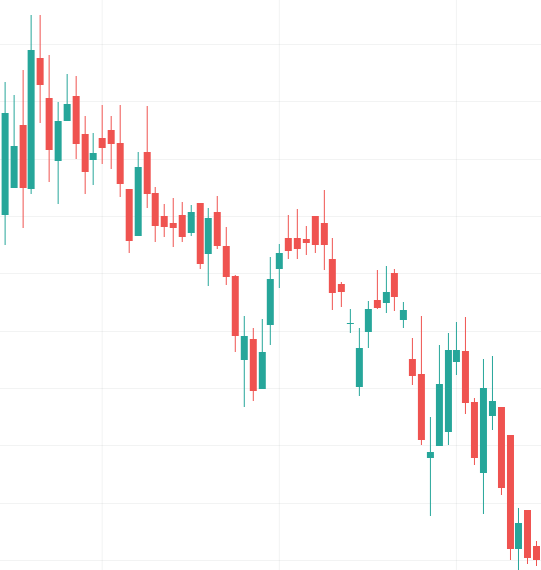
As you see in this chart, the stock price chart is sloping downwards, which is represented by lower highs and lower lows, or you can say troughs and peaks are moving in descending order.
Traders can lose significant amounts of money in this bear market, so they often set a stop-loss of their trade to protect against a downtrend. The security is automatically sold in a stop-loss feature once it reaches a certain price level.
A prolonged downfall in the market is a negative sign for an economy and industry. A bear market for a long time can cause an economic contraction which can further lead to unemployment and reduced consumption in the economy.
It occurs when the number of sellers in a market exceeds the number of purchasers or when any external factor influences the security price.
Trading downtrend
Many traders do not take long positions in such trends as there are worries that the security price may fall even further.
Some investors might take long positions during a downtrend to average the high cost per share.
While trading, a trader should look for the point where the price movements hold up at a particular trough, rise, and then take a peek.
Equity Investors avoid trading in such a trend because they tend to hold a stock for a longer time frame, and such a trend leads to a reduction in overall profit margin.
Traders who trade both long and short go for short-selling stocks during downtrends. Short-selling is a technique where traders first sell (borrow) the stocks at a higher price and then purchase them when prices go down.
The gap between the new and old prices is traders' profits.
It can occur in all trading time-frames - minutes, days, weeks, months, or years.
Traders use a combination of technical indicators and patterns and try to identify trends as soon as possible.
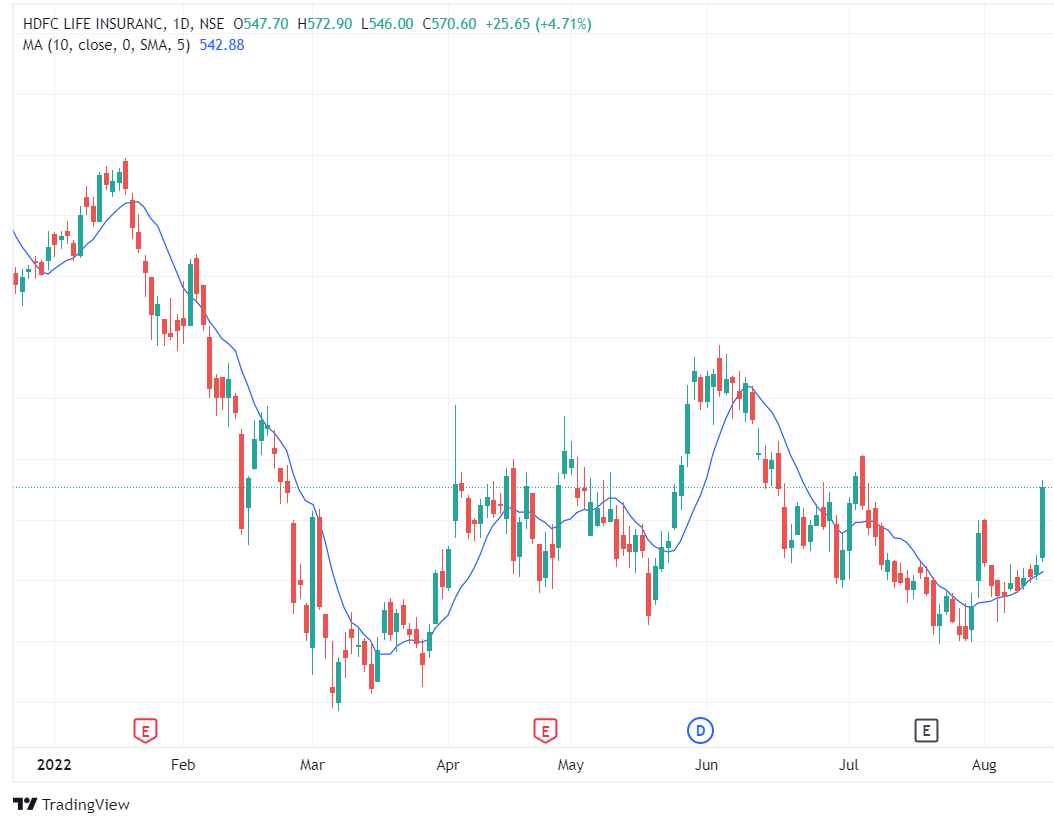
A combination of a price chart and a moving average is used to interpret the trend in a market. When the price is lower than the moving average, a downtrend is expected; if prices are higher than the moving average, then an uptrend is expected.
Indicators like Moving Average Convergence And Divergence (MACD), Average Directional Index (ADX), and Relative Strength Index RSI can also be used to interpret trends in a market.
Early identification helps traders and investors to increase their chances of earning higher profits.
For more info, you can refer to this YouTube video:
Factors Leading to a Downtrend
A few of the factors are:
1. News
Equity prices are very sensitive to price changes due to news and events. Good news related to a particular security can increase the stock price and result in an uptrend, whereas any bad news can decrease the security’s price and result in a downtrend.
For example, An auditor resigning from a company or an increase in the price of raw material used in the manufacturing of a product is bad news for a company and its shareholders, which can result in a fall in the market.
2. Demand and supply
The number of buyers and sellers in the market also plays an essential role in determining the price of a stock.
Suppose the number of sellers and the quantity of security they want to sell is more than the number of buyers and security they want to purchase. Then, according to market players, security should not be valued as high as it is. Thus it leads to a decrease in the price of a security.
Similarly, the number of sellers and the quantity of security they want to sell is less than the number of buyers and security they wish to purchase. So then, according to market players, security should not be valued as low as it is. Thus it leads to an increase in the price of an asset.
Downtrend FAQs
This trend can be observed in all trading time-frames like minutes, days, weeks, months, or years.
It is a strategy that is used for making money in falling markets.
Short sell is a technique when traders sell shares at higher prices, and when the market falls, they buy back the shares at a lower price.
The three major factors are as follows -
1. News.
2. Change in financials of a company.
3. Demand and supply or the number of buyers and sellers in the market.

Free Resources
To continue learning and advancing your career, check out these additional helpful WSO resources:


or Want to Sign up with your social account?