Russell 2000
An index that tracks the 2000 small-cap stocks publicly listed on the US stock exchange


What is The Russell 2000?
Russell 2000 (RUT) is an index that tracks the 2000 small-cap stocks publicly listed on the US stock exchange. The index is managed by FTSE Russell, a benchmarking company that provides analytics and data solutions using quantitative aspects of businesses and industries.
Notably, FTSE Russell is a London Stock Exchange Group (LSEG) subsidiary. This means LSEG owns more than 51% of the shareholding in FTSE Russell.
RUT is a benchmark used by various mutual funds, pension funds, hedge funds, investment banks, brokers, analysts, and investors to track small-cap sectors or companies much smaller than conglomerates and diversified businesses.
In essence, RUT helps measure the day-to-day volatility of the stocks in the small-cap sector. Additionally, RUT is a subset of Russell 3000, which has around 97% of all the publicly listed companies on the stock exchange in the United States.
The total market capitalization of the Russell 2000 is just around 7% of the Russell 3000. With large caps contributing 93% of Russell 3000’s market cap, the 3000 index has smaller small-cap companies but fewer larger large-cap companies.
- Rebalanced yearly, it selects the top 2000 stocks based on market cap, excluding financial viability or liquidity, impacting portfolio strategies.
- Investors access the Russell 2000 through ETFs like iShares Russell 2000 (IWM), mutual funds, or direct stock purchases via brokerage accounts.
- The Russell 2000 primarily consists of Industrials, Financials, Health Care, Consumer Discretionary, and Technology sectors, impacting its overall performance.
- The Russell 2000 divides into Growth and Value indices, showcasing high-growth potential companies and undervalued firms respectively, aiding investors in strategic decisions.
Russell 2000 Importance
Small-cap companies are imperative in developing an economy by promoting and increasing employment, generating national income, and supporting different communities.
These companies are abundant but need more financial resources. These businesses strive to grow consistently over time.
Such companies have more potential compared to the already matured large-cap companies. For example, Amazon was a small-cap company before it became mainstream after gaining international traction.
However, even though they have the potential to generate huge returns, small-cap companies are also risky investments.
- Russell 2000 accurately represents top small-cap companies in the US Equity Market
- It is based on objective construction methodology, providing an unbiased, complete view of the equity market and underlying market segments
- It has a modular market segmentation as it provides insight into the current state of the market and informs asset allocation decisions
- RUT has “reliable maintenance” and “governance” as FTSE Russell operates it
- RUT helps in ascertaining the market sentiment for the small-scale business segment
Russell 2000 Calculation
But how is the Russell 2000 index calculated, as it contains 2000 stocks?
1. Calculation Methodology
As discussed above, RUT is a market-value-weighted index in which the market capitalization is given weights, which are calculated by assigning such weights.
A standard version of the market-value-weighted index is free-float weighting. This method assigns a floating factor to the total outstanding shares held by the “general public” instead of “closely held” claims by the government or promoters.
For example, suppose the promoters hold 65% of a company’s total shares. In that case, the general public has institutional investors, the government, and the remaining 35%. Then the float factor will be 0.35.
The float factor is multiplied by the market cap of a company. Next, the weights are assigned to each company. Lastly, the index is calculated.
FTSE Russell provides float-adjusted, market capitalization-weighted indices for a precise market picture. RUT is also calculated through the same method.
S&P 500 has changed from a market-value-weighted index to a float-weighted index.
2. Annual Reconstitution
RUT is reconstituted (or rebalanced) annually at the end of June. For this process, the stocks are ranked according to their respective market cap as it was on May 31. By the output of this process, the top 1000 stocks are included in Russell 1000, while the subsequent 2000 stocks go to RUT.
Reconstitution of the index does not consider financial viability, liquidity, or IPO seasoning. Reconstitution of RUT is made annually because the large companies may disturb the growth or performance of stocks from smaller firms.
A company must have publicly floated 5% of its shares to enter this index. In addition, the domicile of the company, which are its fixed assets, revenues, and listing, must be from the US only. The classification of sectors depends on the proprietary sector classification framework.
The annual reconstitution of RUT exerts downward price pressure:
“As winners from the Russell 2000 graduate to the Russell 1000, and losers from the Russell 1000 move down to the small-cap index, fund managers are forced to sell winners and buy losers, thereby creating a negative momentum portfolio (Furey 2001).”
Source: S&P Global
How to Invest in the Russell 2000?
The very first step to investing in the Russell 2000 is the creation of a brokerage account. A brokerage account is one used most famously by investors to trade assets.
Following the creation of the brokerage account, investing can be done via the Exchange Traded Funds (ETFs) and Mutual Funds. Here is a brief description on these financial instruments:
1. Exchange Traded Funds (ETFs)
ETF tracks a particular index (in this case Russell 2000), commodity, or even a sector. It can be purchased or sold on a stock exchange. The largest ETFs are:
- BlackRock iShares Russell 2000 ETF (IWM)
- Vanguard Russell 2000 ETF (VTWO)
- ProShares UltraPro Russell2000 (URTY)
- SPDR Russell 2000 ETF (TWOK)
2. Mutual Funds
Certain mutual funds are designed with the sole purpose of replicating the Russell 2000 index. These mutual funds have a particular name that is, index funds, also known as passively managed funds.
3. Alternate route
An alternate way to invest in the Russell 2000 is by directly purchasing stocks of the individual companies listed in the Russell 2000 index.
After an investor opens their brokerage account and chooses which way to invest, it must be followed by thorough research and consultation with financial experts.
Post-investment, it is vital to manage and monitor one’s investment and further diversify their portfolio as and when needed.
Russell 2000 Analysis
Established in 1984 by the Frank Russell Company, the Russell 2000 is currently managed by a subsidiary of LSEG, FTSE Russell.
As shown in the chart below, the small-cap companies in the US had grown drastically over three and a half decades, increasingly contributing to the national economic development.

Source: Marketwatch
RUT contains 2000 small-cap stocks, which are considered riskier because of two factors:
- They are highly volatile in the stock market and possess a high Beta.
- They have uncertain futures regarding business and stock performance.
Source of image: Research FTSE Russell
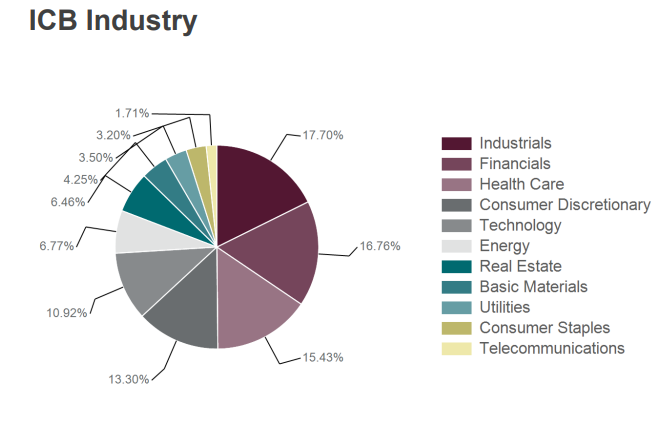
The Industry Classification Benchmark (ICB) is a detailed and comprehensive structure for sector and industry analysis, facilitating the comparison of companies across four levels of classification and national boundaries.
RUT has 3/4th of small-cap stocks in the Industrials, Financials, Health Care, Consumer Discretionary, and Technology sectors.
This makes the top 5 sectors driving the RUT (as of February 28, 2023).
Source of the image: Research FTSE Russell
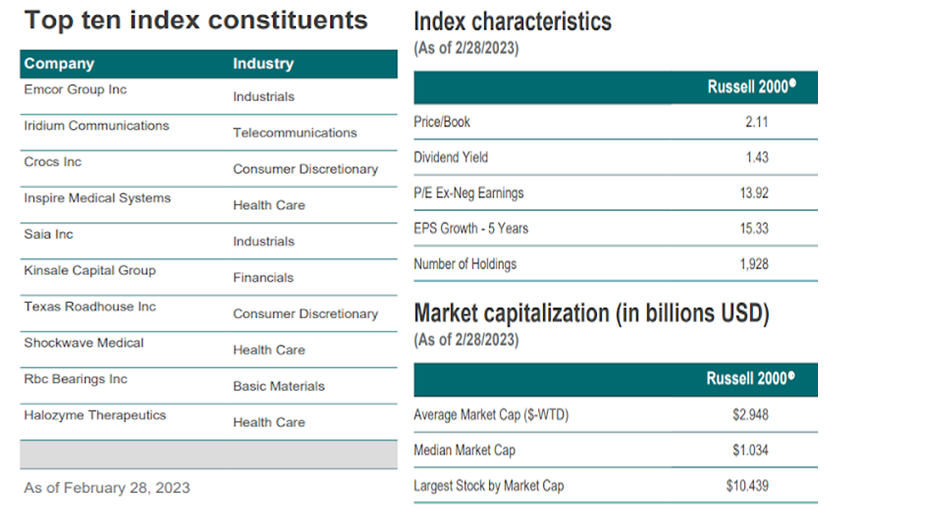
9 out of the top 10 stocks of the Russell 2000 belong to the top 5 sectors mentioned above.
The price-to-book value of the index RUT is 2.11, meaning, on average, all 2000 companies have a market value of $2.11 to every $1 of their net worth. The dividend yield for RUT represents the average dividend yield of 2000 companies, which comes out to 1.43% of its profits.
The price-to-earnings ratio (excluding companies with negative earnings) is at 13.92x, indicating that the price is 13.92 times the Earnings per Share.
The earnings-per-share growth of the 2000 companies over five years is 15.33%.
Russell 2000 Key Metrics
The Russell 2000 can be further split into 2 important key metrics or subsets. They are the Russell 2000 Growth Index and the Russell 2000 Value Index. Following is a brief description of both:
1. Russell 2000 Growth Index
This indicator measures the small-cap growth segment’s performance in the US equity market. It comprises those companies that demonstrate strong growth potential based on certain criteria. These companies features are as follows:
- High price-to-earnings/values ratio
- High growth values (forecasted)
- Lower dividend yields due to increased reinvestment back into the company for more growth or company expansion
This index is reconstituted on an annual basis to ensure that new and growing equities that satisfy the above-mentioned characteristics are included.
2. Russell 2000 Value Index
The Russell 2000 Value Index includes those small cap companies that are considered undervalued. Following are the companies characteristics:
- Lower price to earnings/values ratio
- Lower growth values (forecasted)
- High dividend yields as they distribute most of their earnings among the shareholders
Russell 2000 FAQs

An investor can purchase all the 2000 stocks in RUT and rebalance it annually, but that will become a cumbersome task.
An investor can invest in an Exchange Traded Fund (ETF) of the RUT or purchase an index fund. These funds copy the investments in the RUT and also rebalance annually.
There are many brokerage firms where one can purchase an ETF. An index fund can also be bought from different mutual fund services.
S&P 600 is also an index that has 600 small-cap stocks which are publicly listed on the US stock exchanges.
There is not much difference between the performance of the Russell 2000 and S&P 600 small-cap from 2013-2023. An investment of USD 1.00 in the S&P SmallCap 600 over the same period would have returned USD 3.14, while it would have returned USD 3.25 if invested in the Russell 2000.
Hence, S&P 600 has a CAGR of 12.14%, and RUT has a 12.47% over a decade.
Everything You Need To Master Financial Statement Modeling
To Help You Thrive in the Most Prestigious Jobs on Wall Street.


or Want to Sign up with your social account?