2010 Flash Crash
Stock market indices, including the S&P 500, Dow Jones Industrial Average, and Nasdaq Composite, experienced a sharp decline and recovery


What Is The 2010 Flash Crash?
Stock market indices, including the S&P 500, Dow Jones Industrial Average, and Nasdaq Composite, experienced a sharp decline and recovery.
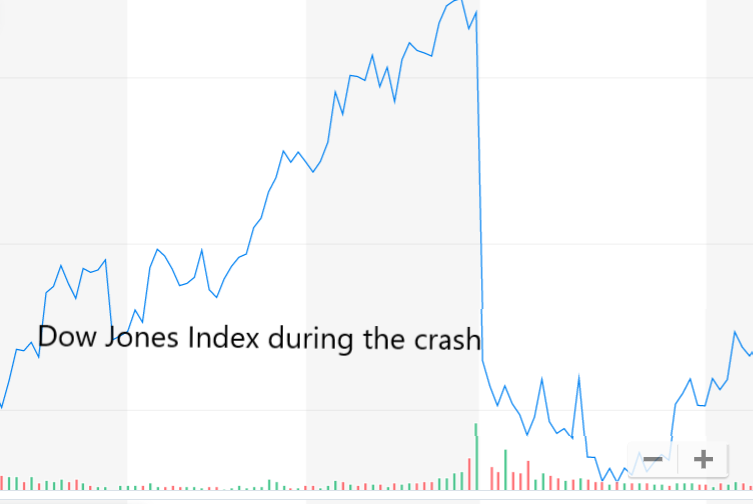
The Dow Jones Industrial Average fell by 998.5 points (or nearly 9%) in its second-largest intraday point decrease up to that point, with most of the loss being made up within minutes. It was one of the most volatile times in the history of the financial markets, according to a CFTC report from 2014.
With a difference of 1,010.14 points between the intraday high and low, it was also the second-largest intraday point swing up to that time. Trading volume increased due to the erratic prices of stocks, stock index futures, options, and exchange-traded funds (ETFs).
The Dow started to fall on May 6, 2010, and continued to trend lower throughout the day due to concerns about the looming U.K. elections and the Greek financial crisis. The equities market started to decline quickly at 2:42 p.m., with the Dow already down more than 300 points for the day.
Within five minutes, the market lost another 600 points, nearly 1,000 points for the day by 2:47 p.m. By this time, major equity and futures indexes were down 4% from their previous day's closings.
For a brief period, the shares of eight significant S&P 500 companies—including Accenture, CenterPoint Energy, and Exelon—fell to one cent each, while those of other companies—such as Sotheby's, Apple Inc., and Hewlett-Packard—rose in value to well over $100,000.
Procter & Gamble experienced a decline of around 37% before quickly recovering to values close to those of the previous minutes.
A few human investors eventually stepped forward to help. The markets then resumed their ascent at this point. As soon as other computers saw, they began to buy.
Observing this, other computers followed suit. This is a classic case of the domino effect.
This is how the 20-minute flash crash (and recovery) happened.
The International Organization of Securities Commissions, a global organization of securities regulators, stated in July 2011 that market participants had used algorithms and HFT technology to manage their trading, and risk is a contributing factor.
One such view contends that high-frequency traders' (HFTs') activities were the root cause of the flash crash because these HFTs send non-executable orders (orders outside the bid-ask spread) to exchanges in batches based on analysis of bid-ask data.
-
The 2010 Flash Crash saw major stock indices plummeting nearly 9% before swiftly recovering, marking one of the most volatile periods in financial market history.
-
The crash involved substantial intraday point swings, with a difference of over 1,000 points between the high and low points, highlighting the extreme turbulence in the markets.
-
The crash was triggered by various factors including concerns about the U.K. elections and the Greek financial crisis, which led to a rapid decline starting on May 6, 2010.
-
The crash prompted new trade limitations and circuit breakers to mitigate future disruptions and improve market stability.
Causes of The 2010 Flash Card
The event may have been precipitated by a fat-finger trade (essentially a mistype/misclick) or an unintentionally large "sell order" for Procter & Gamble stock in 2010, immediately following the plunge, according to several reports. Procter and Gamble declined after the E-Mini S&P 500 futures contract declined significantly.
Deliberate market manipulation is improbable. Instead, it is more likely that these transactions were intended to evaluate latency times and identify emerging price patterns.
Whatever the motivations for these orders, this theory holds that they worsened the crash on May 6 by overcrowding the exchanges.
Technical errors in reporting prices on the NYSE and several alternative trading systems (ATSs) were revealed by an investigation of trade on the exchanges in the moments just before the flash collapse, which may have contributed to the drying up of liquidity.
This theory holds that NYSE technological issues caused delays in quotes being reported on the Consolidated Quotation System (CQS), despite time stamps showing that the quotes were current for up to five minutes.
Some market players, however, who had access to OpenBook, NYSE's quotation reporting system, could see both the accurate, most recent NYSE quotes and the delayed but evident CQS quotes.
Nearly five years after the event, on April 21, 2015, the U.S. Department of Justice charged an Indian-origin British financial trader, Navinder Singh Sarao, with criminal offenses, including fraud and market manipulation.
Immediately before the flash crash, he was accused of using spoofing algorithms to place orders for thousands of E-mini S&P 500 futures contracts that he intended to cancel later.
Before being canceled, these orders, which totaled roughly $200 million in wagers on the market, had been "replaced or amended 19,000 times." In addition, front running, layering, and spoofing are now prohibited.
Introduction To Machines
Machines began with systems as simple as the wheel and axle, a simple machine used to make tasks effortless in manipulating force by applying the concept of mechanical advantage.
The Industrial Revolution introduced new chemical production techniques and improved machine tools. The advent of the mechanized factory system is an example of the transition from manual to machine production methods. As a result, productivity significantly rose, leading to a phenomenal population growth rate.
Vacuum tubes were the primary memory and CPU (central processing unit) circuitry components in the earliest computers. Unfortunately, these tubes generated a lot of heat, similar to electric lights, and the installations were frequently fused.
Second-generation computers that came with transistors were more affordable, power-efficient, small, quick, and dependable than first-generation devices.
The transition from mechanical and analog electronics to digital electronics started in the late 20th century with the acceptance and widespread use of digital computers and digital record-keeping. It is still going on today and is known as the "digital revolution."
Due to growing interconnectedness and intelligent automation, the Fourth Industrial Revolution envisions significant changes to technology, industry, and processes in the 21st century.
Why this long introduction to machines and their evolution in a stock market crash article? This crash was not a response to some geopolitical situation or a bubble burst but due to an order executed by a machine.
This crash came like a flash and wiped billions out of markets before rebounded. This shows how we are virtually inseparable from technology in our real lives and how it can have catastrophic effects on our lives if not governed properly.
Computers in the stock market
Belgium was the first country to have a stock market. It dates back to 1531. Then, brokers and moneylenders would gather to discuss corporate, governmental, and even private debt matters.
In the 1600s, the Dutch, British, and French governments chartered the East India Company, which issued shares on paper. Investors could sell the shares to other investors.
The year 1773 marked the official founding of the first stock exchange in London. But, surprisingly, the NYSE isn't the U.S.'s oldest stock exchange.
The Philadelphia Stock Exchange (PHLX), the first recognized U.S. securities exchange, was established in Philadelphia, Pennsylvania, in 1790.
In the early 1900s, manual brokers conducted transactions and recorded them on a ledger. Then, around the 1970s, computers began to emerge in stock markets. However, there has only been an increase in their presence since then.
Investors started using them for pretty basic operations. For example, simple functions like limit orders were placed using computers.
This is an example of an algorithm—a set of instructions given to a computer. This gave rise to a new age of trading. Algorithmic trading and computer instructions became more complex, and various technical analysis parameters came into play.
One of the algorithmic trading's most significant features is that it eliminates the emotional element from trade execution. Due to the enormous daily transactions that institutional investors like hedge funds, investment banks, etc., conduct, they frequently use algorithms.
The sophistication and speed of computers increased. The stock exchange itself improved its computer management.
Today, it is possible to judge whether to purchase or sell shares in a matter of seconds by analyzing the words of influential leaders making significant announcements.
These computers began trading with other computers over time. These computers can buy, hold, and sell stocks in nanoseconds. As a result, each investor began acquiring more efficient computers to gain an advantage over other investors.
About 70% of trades on U.S. stock exchanges are essentially automated trades. However, computers aren't merely utilized for fast buying and selling. In reality, algorithms are used today to place practically all significant orders.
You need to be a software engineer or have programming experience to write algorithms. Today's traders use Python as a coding language extensively. To learn Python and stay in the game, try this WSO course.
Effect on HFT & Effect of HFTs
Effect on HFT
High-frequency trading increased from 22 percent of all trades in the futures markets for commodities and currencies in 2009 to 28 percent in 2011. However, a string of "flash crashes" in those markets coincided with the expansion of automated and high-frequency trading in commodities and currencies.
Computer programs have replaced human market makers, who connect buyers and sellers and give liquidity to the market. As a result, a sudden, giant swing could have resulted from these robot market makers pulling back from the market.
Effect of HFTs
High-frequency and algorithmic trading is criticized for being immoral as it gives big businesses an unfair edge over smaller institutions and investors. High-frequency traders profit from an imbalance between supply and demand by taking advantage of arbitrage and speed.
As a result, their trades are driven by opportunities rather than in-depth analysis of the company or its growth potential.
Although HFT doesn't have a specific objective, it can harm institutional and ordinary investors, including mutual funds that make large purchases and sales.
Last but not least, computers have improved the financial industry and the way we live. Giving them unchecked authority, however, might have disastrous results because people are the most complex machines ever created and can discern signals that computers cannot.
Human investors intervened in this situation and stabilized the markets before a further decline.
Trails and regulations
During American Congressional hearings on the flash collapse, the NASDAQ revealed its timeline of the anomalies.
According to the schedule provided by NASDAQ, NYSE Arca may have played a key role early on, and the Chicago Board Options Exchange sent a notice stating that NYSE Arca was "out of NBBO" (national best bid and offer).
A self-help declaration was made against NYSE Arca by the Chicago Board Options Exchange, NASDAQ, and NASDAQ OMX.
New trade limitations, commonly referred to as circuit breakers, were examined over a six-month trial period concluding on December 10, 2010, according to announcements made by officials.
Any S&P 500 stock with an increase or loss of more than 10% over five minutes would see trading on that stock halted for five minutes. Only the 404 S&P 500 stocks listed on the New York Stock Exchange would have circuit breakers installed.

Free Resources
To continue learning and advancing your career, check out these additional helpful WSO resources:


or Want to Sign up with your social account?