Shooting Star
Refers to a bearish candlestick pattern formed up of a long upper shadow, little or no lower shadow, and a small real body near the day's low.


What is a Shooting Star?
A shooting star formation is a bearish candlestick that occurs in candlestick charting. It has a long upper shadow, little or no lower shadow, and a small real body near the day's low.
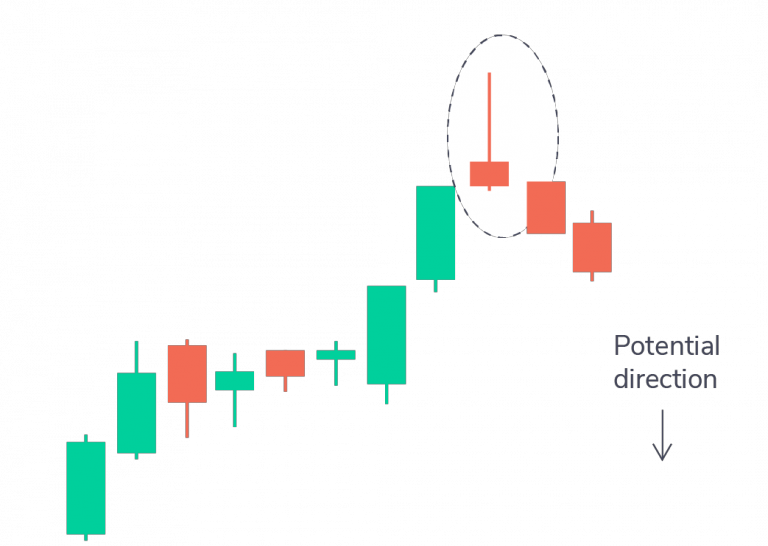
It appears after an uptrend. A candlestick forms when a security opens and advances significantly but closes the day near the opening again.
The candlestick formation must appear during a price advance for a candlestick to be considered a shooting star. Also, the distance between the high of the day and the open price must be more than twice as large as its body.
There should be a little shadow or no shadow below the real body. Therefore, it is interpreted as an impending bearish reversal to the downside.
To be precisely interpreted, the formation is considered valid only when it appears following a recognizable uptrend of some duration and at or near the highest price in the market session.
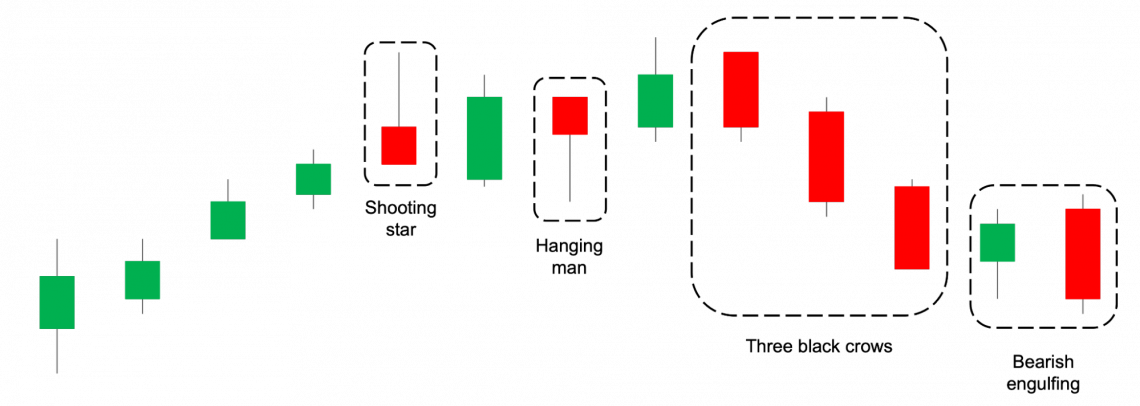
The pattern is one of many signals of potential market reversals recognized in candlestick charting. Other reversal patterns include the hanging man pattern, engulfing candles, and Doji candlestick formations.
- A shooting star is a bearish pattern that forms in candlestick trading.
- The pattern is interpreted as a bearish reversal signal, showing a failed attempt to drive the price higher and intense selling action, which ultimately determines the candlestick’s formation.
- The formation is bearish due to the price increasing significantly during the period, but the sellers took over and pushed the price back towards open.
- If the price rises after the formation, it may have been a false signal, or the candlestick is marking a potential resistance area around the price range of the candle.
Identifying the Shooting Star Pattern
Like all candlestick patterns, this pattern must be correctly identified to be helpful to traders. The key characteristics of this candlestick pattern are as follows:
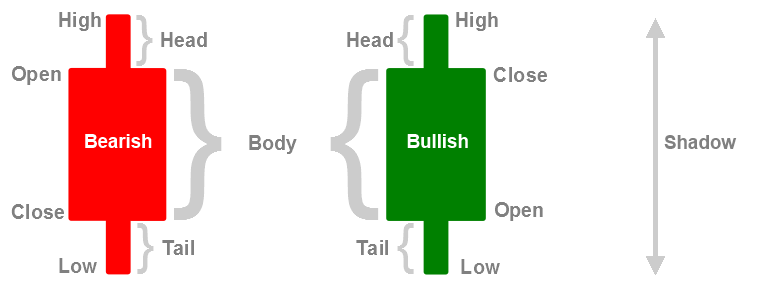
- The upper tail is also known as a "shadow," which is the line that forms above the candlestick's body and is at least two to three times longer than the candlestick's body.
- The lower shadow or tail is the line that extends below the candlestick's body. Again, it must be either very short or non-existent; it should, at most, be not much longer than the candlestick's body.
- The candlestick's body should be concise, indicating the opening and closing prices. In other words, the opening and closing prices should be very near each other.
Additionally, there are some characteristics of this formation that, when occurring, signal a possible bearish market reversal.
The first trait is the closing price. A closing price below the opening price indicates that the price moved down for the time frame covered by the candlestick, making for a more robust shooting star pattern. The pattern is also considered stronger if no lower tail or shadow exists.
If the candlestick's closing price is below its opening price, and there is no lower tail extending below its body, that shows that the price closed at the lowest price traded during the candlestick.
Another strong trait of an impending bearish reversal is when the candlestick's upper shadow is much longer than the candlestick's body (three times longer, four times longer, or more).
It indicates that though the price traded significantly higher during the time frame, the candlestick reflects. Higher prices were firmly rejected as sellers entered the market and buyers exited, driving prices sharply down to end the period and form the shooting star pattern.
Shooting Star vs. Inverted Hammer
The table offers a succinct summary of the main distinctions between the construction, meaning, and context of the Inverted Hammer and Shooting Star candlestick patterns.
| Aspect | Shooting Star | Inverted Hammer |
|---|---|---|
| Structure |
|
|
| Interpretation | Bearish reversal signal | The bullish reversal signal in the downtrend; the potential bearish reversal in the uptrend |
| Context | More reliable after a price advance or in overbought conditions | More meaningful after downtrend or in oversold conditions |
An inverted hammer has a short candle with a long upper shadow. It shows that some selling pressure followed strong buying power. Overall, it indicates more buyers than sellers because the price has closed above open.
This is the exact opposite of a normal bullish hammer candle.

It marks a potential bearish turning point and occurs after a price advance. Conversely, an inverted hammer marks a potential bullish turning point and occurs after a price decline.
Interpreting the Shooting Star
Its appearance on the technical charts signifies that a security's price has reached a high and a reversal is around the corner. This pattern is most predictive when it forms after three or more consecutive candles rising with higher highs.
Its occurrence is possible even during a period of overall rising prices with few bearish candles.
Following the advance, the star opens and moves higher during the session. This is an indication of buying pressure. However, as the session proceeds further, sellers step in and cause the price to fall back to its open price, erasing the gains made during the candle.
The long upper shadow depicts the buyers who purchased during the session but are currently in a losing position as the price falls back to the candle's open level.
Traders must know that the candle formed after the shooting star pattern confirms the candlestick pattern. Therefore, the next candlestick's high must stay below the shooting star's high and end below the pattern's close.
The ideal formation is formed when the candle after the star gap lowers or opens near the previous close and wanes lower on heavy volumes.
A bearish day following a star appearance confirms the price reversal, indicating that the prices could continue to fall. However, even if the prices rise, the price range may act as a resistance.
Example of How to Use the Shooting Star
This is a 2-minute chart of Hewlett Packard from June 10, 2016. The image illustrates a classic shooting star trading example.
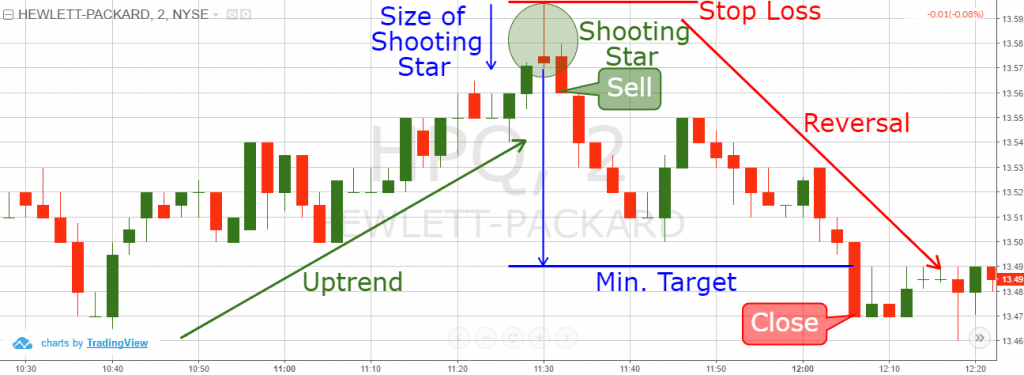
The trading analysis starts with identifying the upward trend in price.
Suddenly, a shooting star candlestick appears, marked with a green circle on the chart. In addition, we can observe a small candle body and a big upper wick, confirming the pattern.
1. Entry
The next candle after is bearish, confirming the pattern.
After the pattern confirmation, we sell the security by placing a stop loss order above the upper wick of the star candle to secure our short trade.
This way, we will be protected if the price creates an unexpected bullish move caused by high volatility.
Our maximum loss will equal the distance between the level we short Hewlett-Packard (HPQ) and the stop loss order level.
The first blue arrow in the image measures the size of the candlestick. According to the strategy, we should see a target equal to three times the size of the pattern.
2. Profits Raining
Starting from the lower candle wick, we applied the size of the pattern three times. This is how we got the big blue arrow, which points out the minimum target of our trading strategy.
To maximize profits, we need to stay in the trade until the price action closes a candle beyond the minimum target.
The price created one correction during the bearish move down. After that, the downward activity resumed, and after 18 periods, we shorted HPQ. The price action closed a candlestick below the minimum target of the star pattern.
3. Exit
The candle is relatively big and goes way beyond the minimum target—a perfect opportunity to exit.
The star candle pattern indicates that the trend might reverse. This creates an excellent setup to short Hewlett Packard right at the beginning of an emerging bearish trend.
Despite the minor correction on the way down, it reaches the target of three times the size of the candlestick.
Conclusion
In candlestick charting, a shooting star is a bearish candlestick pattern that suggests the market may be about to reverse its upward trend. It is distinguished by a small actual body close to the day's low, a long upper shadow, and little or no lower shadow.
When a pattern appears at or close to the session's peak price and coincides with a discernible upswing, it is regarded as legitimate.
The shooting star pattern is easily recognized by traders thanks to its distinguishing features, which include a short upper shadow that represents sellers entering the market and rejecting higher prices and a succinct body with a closing price below the opening price.
According to the shooting star pattern, purchasers first drove prices higher but were unable to keep control, which resulted in a reversal. After the pattern is confirmed, traders usually initiate short positions with stop-loss orders placed above the upper wick of the star candle.
Exits are carried out when the price action closes below the minimum objective. Typically, profit targets are set at three times the size of the pattern.
The traders can profit from developing market downtrends and spot possible bearish reversals by using the shooting star pattern.
Shooting Star FAQs
This candlestick pattern is a beneficial technical analysis tool for noticing a bearish divergence in the market. This pattern is an indicator that may be helpful for traders who went long on the market looking for an exit, or for an entry point to go short.
We can recognize this candlestick pattern on the chart by looking at the upper shadow of the two candlesticks you are analyzing and how near the open, low, and closing prices are for the chosen period.
If the upper shadow is large and the open, close, and low prices are almost the same, we can see the formation often interpreted by traders as a sign of a bearish move.
In forex, the pattern is similar, just like in any other chart. Let us choose a forex currency pair; the candlestick for our forex pair would open, close, and find a low at similar price points.
In this case, the closer the price points, the larger the upper shadow, the tighter the pattern, and the more likely the currency pair you are speculating about will fall.
This is a bullish analysis tool used to notice market divergence from a previously bearish trend to a bullish rally. This pattern is more commonly known as an inverted hammer candlestick.
It can be recognized from its appearance, i.e., a long lower shadow and tight open, close, and low prices. The difference is that the inverted hammer candlestick will have a bear run before the candle we are looking at.
The bullish version of this formation is the inverted hammer formation that occurs at the bottoms. Another similar candlestick pattern is the gravestone Doji.
Free Resources
To continue learning and advancing your career, check out these additional helpful WSO resources:


or Want to Sign up with your social account?