Hammer Candlestick
It resembles a candlestick with a small body and a long lower wick, indicating a bullish reversal signal


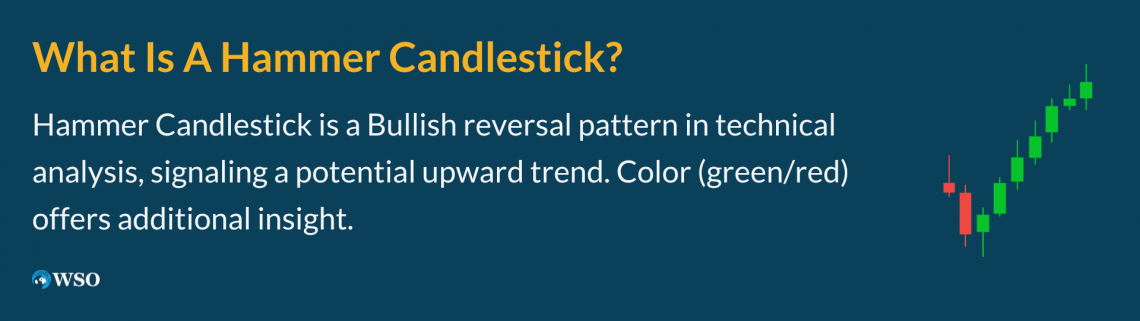
What Is a Hammer Candlestick?
A Hammer Candlestick is a term used in technical analysis. It resembles a candlestick with a small body and a long lower wick. This pattern typically appears when a downward trend in stock prices is coming to an end, indicating a bullish reversal signal.
When you see a hammer candlestick, it's often seen as a positive sign for investors. It's like a signal that the stock's price may start moving upwards, indicating a shift from a bearish (falling) market to a bullish (rising) one.
Traders often use a combination of several indicators, price patterns, and different candlesticks to interpret current market conditions and check whether the trade will be profitable or not.
It also helps to support the region and signals that the downtrend is over and all the short-selling positions should be closed now. Hammers can occur in all time frames:
- One minute
- Daily
- Weekly
- Monthly
- And so on
Many bullish traders (who expect the market to go up) enter a trade after the formation of the hammer candlestick.
The hanging man candlestick is another type of formation that looks quite similar to a hammer, but, unlike the hammer, the hanging man is created at the end of an uptrend. It is simply a hammer in the other direction.
Usually, the color of a hammer candlestick does not matter, but sometimes, a green hammer gives a stronger indication and more positive results than a red hammer.
A green candlestick means the closing price is higher than the opening price, which means bulls were able to reject and overcome bears completely.
Hanging men (red hammers) give bullish signals, as the closing price is lower than the opening price.
You can refer to this YouTube video to know more about this topic.
- A hammer candlestick formation at a downtrend's end suggests potential trend reversal, often leading to upward price movement.
- Recognize hammers by their "T" shape, short body, and long lower shadow. Look for downtrend conclusion, long shadow, and confirmation candle for trading.
- Hammer variations include inverted hammers, hanging men, and doji, each indicating distinct trends and reversals.
- Hammers signal trend changes and short position exits. Combine with other indicators for better accuracy and avoid relying solely on hammers.
- Hammers might need confirmation candles, can give false signals, and are best used alongside other indicators for reliable predictions.
How To Identify And Trade Using A Hammer Candlestick
It looks very similar to the letter 'T.' It is easy to find if present in a security's price chart pattern.
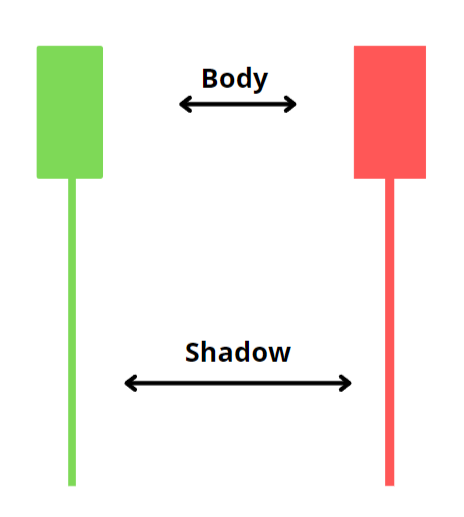
1. Body
The hammer's body is very short because the opening, high, and closing price points lie very close to each other.
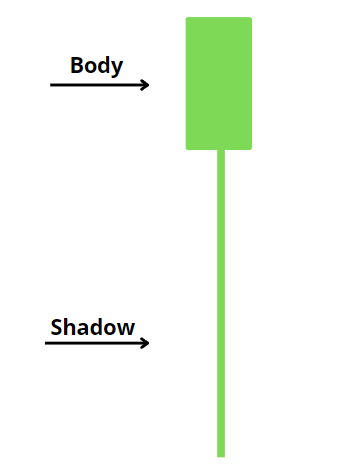
2. Shadow
- Upper wick/shadow: Most hammer candles don't have an upper shadow, and, when observed, it is very small in size. This means that the high and closing prices are very close.
- Lower wick/shadow: The lower shadow of a hammer candle is very long in size. Traditionally, the lower shadow is at least twice as long as the body of the candle.
There is a large gap between a candle's opening and low prices. This is because, initially, bears try to reduce the security price, but after some time, bulls start creating buying pressure and take the security price to a higher level.

But how do we trade using a hammer candlestick? Before initiating a trade, investors should keep certain points in mind:
- First, it should be created at the end of a downtrend, and there should be at least 2-3 bearish candles before the formation of a hammer.
- The lower shadow should be 2-3 times longer than the body of the candle.
- A big green candle (bullish candle) should be formed after the hammer to confirm the reversal, i.e., an uptrend in the price of a security.
Investors usually take a long position after identifying the bullish candle (confirmation candle).
Stop-loss is generally placed at the low of the candle.
Hammer, inverted hammer, doji, and hanging man
Let us understand the difference between some of the related concepts:
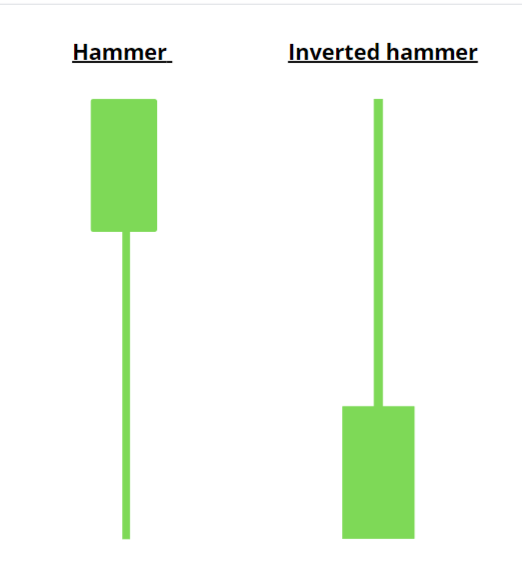
1. Hammer vs. inverted hammer
Both the hammer and inverted hammer are created at the end of a downtrend, signaling bullish reversals in the market trend.
The major difference between both of them is the position of shadow (wick).
In an inverted hammer, an upper shadow is created as the price of the security rises initially but closes near the opening price.
2. Hammer vs. hanging man
A hanging man is observed at the end of an uptrend and generally signals a downtrend (bearish trend).
The overall shape of the hanging man looks quite similar to a hammer candlestick.
A lower shadow is observed in this candle.
The main difference is that a hammer candlestick leads to an uptrend whereas the hanging man leads to a downtrend.
3. Inverted hammer vs. shooting star
The inverted hammer is a bullish reversal candlestick pattern that appears at the end of a downtrend, whereas the shooting star is a bearish reversal candlestick pattern that appears at the end of an uptrend.
The shape of both the inverted hammer and shooting star are quite similar to each other. They both have a long upper shadow with a very small or no lower shadow. Both have small bodies. In addition, both opening, closing, and low are very close to each other.
The only difference between them is the place in which they occur.
4. Hammer vs. Doji candlestick
The former signals an uptrend in a market, whereas a doji candlestick signals trend reversals (it can lead to an uptrend or a downtrend) or continuation of a trend.
Doji is also called an indecisive candle as there is no specific indication/decision. For this reason, doji candles and 2-3 more candlesticks are used to identify the pattern for better outcomes and interpretations.
Hammer Candlestick Advantages and disadvantages
Like any other technical indicator, it has advantages and disadvantages.
The advantages are as follows:
1. Give reversal signal
The formation of a hammer at the end of a downtrend can signal a reversal as well as the chance of a sideways or uptrend in an asset's price chart.
A trade can be initiated after the formation of a hammer candlestick. Taking long positions, therefore, taking the very start of the trend can provide strong profit margins to a trader.
2. Exit signals
Signals that traders should exit any short positions, i.e., bets on the price going down.
This is because it indicates the end of the downtrend and reversals in the markets can.
Thus, traders who had a short position will close their position after forming a hammer candle.
Some of the disadvantages are:
- Sometimes, it becomes difficult for traders to interpret a hammer candlestick as it doesn't always lead to an uptrend. Some traders often wait for a confirmation candle, the formation of a big green candle after the hammer candlestick.
- It is not used as a sole indicator for interpreting outcomes. Thus, a combination of technical indicators like relative strength index (RSI), moving average convergence and divergence (MACD), Fibonacci level, and patterns are used to observe better results.
- It doesn't provide price targets and exit positions.
- The hammer may not always be created at the end of a downtrend. Sometimes, it can be observed during a sideways or an uptrend. Therefore, it can give false signals when it is considered in isolation.
- It is tough to find a perfectly-shaped candlestick (the lower wick is 2-3 times more than the body).
Hammer Candlestick FAQs

A Doji candlestick signals trend reversals or the continuation of a trend. A doji is also called an indecisive candle as there is no specific indication/decision.
It has a small real body with both lower and upper shadows.
The hammer and inverted hammer are both bullish candles, meaning they usually lead to an uptrend. The only difference between them is that a hammer has a long lower shadow, whereas an inverted hammer has a long upper shadow.


or Want to Sign up with your social account?